Application Dependency Mapping Tool Market Size, Share & Demand Report By Type (Agent-Based Tools, Agentless Tools), By Deployment Mode (On-Premise, Cloud-Based), By End-Use (IT & Telecommunications, BFSI, Healthcare, Retail, Manufacturing) & Segment Forecasts, 2025–2034
USD 3950
Market Overview
The Application Dependency Mapping Tool Market size was valued at approximately USD 1.85 billion in 2025 and is estimated to reach USD 2.12 billion in 2026. With increasing reliance on distributed architectures, the market is projected to reach USD 5.48 billion by 2034, registering a CAGR of 11.2% during the forecast period (2025–2034). The growing complexity of enterprise IT ecosystems, driven by cloud adoption, microservices, and hybrid infrastructure models, is a key factor supporting market growth.
One of the primary growth factors is the rising demand for real-time application visibility and performance monitoring. Organizations are adopting dependency mapping tools to understand interconnections between applications, databases, and infrastructure components, which helps reduce downtime and improve operational efficiency. Another important factor is the increasing adoption of cloud computing and DevOps practices, which require automated tools to map dynamic dependencies across environments. Additionally, regulatory compliance requirements and the need for risk management are encouraging enterprises to invest in advanced mapping tools that provide accurate insights into system dependencies.
Key Highlights
- Market size reached USD 1.85 billion in 2025 and is expected to grow to USD 5.48 billion by 2034.
This growth reflects strong demand for advanced IT visibility solutions across complex enterprise environments. - CAGR of 11.2% during the forecast period (2025–2034).
The steady growth rate highlights increasing investments in digital transformation and infrastructure monitoring tools. - Rising adoption of cloud and hybrid IT environments driving demand.
Organizations are deploying dependency mapping tools to manage dynamic workloads and interconnected cloud systems efficiently. - Increasing focus on application performance and operational visibility.
Enterprises are prioritizing real-time insights to reduce downtime and optimize system performance across critical applications.
Market Trends
Integration of AI-Driven Analytics in Dependency Mapping Tools
A prominent trend in the Application Dependency Mapping Tool Market is the growing integration of artificial intelligence and machine learning technologies. Vendors are embedding AI capabilities to enhance real-time monitoring, predictive analytics, and anomaly detection. These tools can automatically identify dependencies, detect unusual behavior, and provide actionable insights without manual intervention. This trend is particularly relevant in large enterprises managing complex infrastructures, where manual mapping is inefficient. AI-driven tools also help reduce mean time to resolution (MTTR) by identifying root causes of system failures more quickly. As organizations seek proactive IT management solutions, the adoption of intelligent dependency mapping platforms is expected to increase significantly.
Shift Toward Cloud-Native and SaaS-Based Solutions
Another key trend shaping the market is the shift toward cloud-native and Software-as-a-Service (SaaS) deployment models. Organizations are increasingly preferring cloud-based dependency mapping tools due to their scalability, flexibility, and lower upfront costs. These solutions support dynamic environments where applications are frequently updated or scaled, making them suitable for modern DevOps and agile workflows. SaaS-based tools also enable remote monitoring and centralized management, which is beneficial for geographically distributed teams. As cloud adoption continues to expand across industries, the demand for cloud-native dependency mapping solutions is expected to grow steadily.
Market Drivers
Increasing Complexity of IT Infrastructure
The rapid evolution of IT infrastructure is a major driver for the Application Dependency Mapping Tool Market. Enterprises are adopting hybrid and multi-cloud environments, microservices architectures, and containerized applications, which significantly increase system complexity. Managing these interconnected systems without proper visibility can lead to inefficiencies and downtime. Dependency mapping tools provide a comprehensive view of application relationships, enabling organizations to manage complexity effectively. These tools also support change management by identifying the impact of updates or modifications across systems. As IT environments become more intricate, the need for advanced mapping solutions continues to grow.
Rising Demand for Application Performance Monitoring
Another key driver is the increasing demand for application performance monitoring and optimization. Businesses rely heavily on digital applications for operations and customer engagement, making performance a critical factor. Dependency mapping tools help organizations understand how different components interact, enabling them to identify bottlenecks and optimize performance. These tools also support incident management by providing real-time insights into system dependencies. As enterprises focus on improving user experience and minimizing downtime, the adoption of dependency mapping solutions is expected to rise significantly.
Market Restraint
High Implementation Complexity and Integration Challenges
One of the primary restraints affecting the Application Dependency Mapping Tool Market is the complexity associated with implementation and integration. Deploying these tools in large organizations often requires significant time, resources, and technical expertise. Integrating dependency mapping solutions with existing IT systems, including legacy infrastructure, can be challenging and may lead to compatibility issues. Additionally, the initial setup and configuration process can be complex, particularly in environments with diverse technologies and platforms. This can discourage small and medium-sized enterprises from adopting these solutions. For example, organizations with outdated systems may face difficulties in achieving accurate mapping results, which can limit the effectiveness of the tool. As a result, despite the benefits, adoption may be slower in certain segments of the market.
Market Opportunities
Growing Adoption Among Small and Medium Enterprises (SMEs)
The increasing digitalization of small and medium enterprises presents a significant opportunity for the Application Dependency Mapping Tool Market. SMEs are adopting cloud-based solutions and modern IT infrastructure to enhance efficiency and competitiveness. As these organizations expand their digital operations, the need for visibility into application dependencies becomes essential. Vendors are introducing cost-effective and easy-to-deploy solutions tailored for SMEs, which is expected to drive adoption. Additionally, the availability of SaaS-based tools reduces the need for heavy upfront investment, making these solutions more accessible. This trend is likely to create new growth avenues for market players.
Expansion of DevOps and Continuous Delivery Practices
The growing adoption of DevOps and continuous delivery practices offers another promising opportunity for the market. These methodologies require frequent updates and rapid deployment of applications, which increases the need for real-time dependency mapping. Tools that can automatically track changes and provide insights into system dependencies are becoming essential in DevOps environments. Dependency mapping solutions help ensure smooth deployment processes and reduce the risk of failures. As organizations continue to embrace agile development practices, the demand for advanced mapping tools is expected to increase significantly.
Segmental Analysis
By Type
The agent-based tools segment dominated the market in 2024, accounting for approximately 58% of the total market share. These tools are widely used due to their ability to provide detailed and accurate insights into application dependencies. Agent-based solutions are installed directly on systems, enabling them to collect comprehensive data and monitor performance in real time. This makes them suitable for complex IT environments where precision and reliability are critical. Large enterprises, in particular, prefer agent-based tools due to their advanced capabilities and ability to support extensive infrastructure.
The agentless tools segment is expected to grow at the fastest CAGR of 12.8% during the forecast period. The growth of this segment is driven by the increasing demand for easy-to-deploy solutions that require minimal configuration. Agentless tools do not require installation on individual systems, making them more flexible and cost-effective. These solutions are particularly attractive to small and medium-sized enterprises, as well as organizations with dynamic IT environments. The ability to quickly deploy and scale these tools is a key factor supporting their growth.
By Deployment Mode
The on-premise segment held the largest market share in 2024, accounting for approximately 54% of the total market. Many organizations prefer on-premise deployment due to concerns related to data security and control. These solutions allow enterprises to maintain full control over their data and infrastructure, which is particularly important in industries such as finance and healthcare. On-premise tools also offer customization options, enabling organizations to tailor solutions to their specific needs.
The cloud-based segment is expected to grow at the highest CAGR of 13.5% during the forecast period. The increasing adoption of cloud computing and SaaS solutions is a major factor driving this growth. Cloud-based dependency mapping tools offer scalability, flexibility, and cost efficiency, making them suitable for modern IT environments. Organizations are increasingly shifting toward cloud deployment to support remote work and distributed teams. This trend is expected to continue, driving the growth of the cloud segment.
By End-Use
The IT and telecommunications segment dominated the market in 2024, accounting for approximately 46% of the total market share. This segment relies heavily on complex IT infrastructure and requires advanced tools to manage application dependencies. Dependency mapping tools help telecom companies ensure network reliability and optimize performance. The increasing demand for high-speed connectivity and digital services is further driving the adoption of these tools in the IT and telecom sector.
The BFSI segment is expected to grow at the fastest CAGR of 12.9% during the forecast period. Financial institutions are increasingly adopting dependency mapping tools to enhance system reliability and ensure compliance with regulatory requirements. These tools help banks and financial organizations manage complex IT systems and reduce the risk of downtime. The growing adoption of digital banking and fintech solutions is a key factor supporting the growth of this segment.
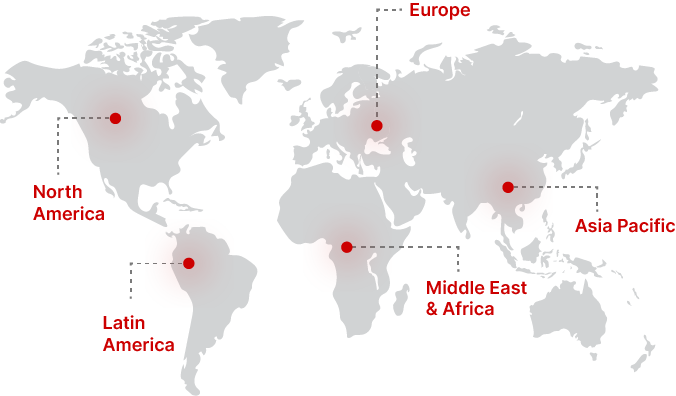
Regional Analysis
North America
North America accounted for the largest market share of approximately 38% in 2025 and is expected to maintain its dominance throughout the forecast period. The region is projected to grow at a CAGR of around 10.8% from 2025 to 2034, driven by the widespread adoption of advanced IT solutions and cloud technologies. The presence of established enterprises and high investment in digital transformation initiatives are key factors contributing to market growth in this region.
The United States dominates the North American market due to its strong technological infrastructure and early adoption of innovative solutions. A unique growth factor in this region is the increasing focus on cybersecurity and risk management. Organizations are using dependency mapping tools to identify vulnerabilities and improve system resilience, which is supporting market expansion.
Europe
Europe held a market share of approximately 26% in 2025 and is expected to grow at a CAGR of 10.5% during the forecast period. The region is witnessing steady growth due to increasing adoption of cloud-based solutions and regulatory compliance requirements. Organizations are investing in dependency mapping tools to ensure transparency and compliance with data protection regulations.
Germany leads the European market, supported by its strong industrial base and focus on digital transformation. A unique growth factor in Europe is the emphasis on data privacy and governance. Dependency mapping tools are being used to track data flows and ensure compliance with strict regulatory frameworks, driving demand in the region.
Asia Pacific
Asia Pacific accounted for around 21% of the market share in 2025 and is projected to grow at the highest CAGR of 12.5% during the forecast period. Rapid digitalization, increasing adoption of cloud technologies, and expanding IT infrastructure are key factors driving market growth in this region.
China is the dominant country in the Asia Pacific market, supported by its large-scale digital transformation initiatives. A unique growth factor is the rapid expansion of e-commerce and digital services, which require robust IT infrastructure and dependency mapping solutions to ensure seamless operations and scalability.
Middle East & Africa
The Middle East & Africa region held a market share of approximately 8% in 2025 and is expected to grow at a CAGR of 9.6% during the forecast period. The region is gradually adopting advanced IT solutions as part of digital transformation initiatives across various industries.
The United Arab Emirates is a key contributor to market growth in this region. A unique growth factor is the increasing investment in smart city projects and digital infrastructure. Dependency mapping tools are being used to manage complex IT systems and ensure efficient operation of digital services.
Latin America
Latin America accounted for around 7% of the market share in 2025 and is projected to grow at a CAGR of 9.2% during the forecast period. The region is experiencing gradual adoption of cloud-based solutions and digital technologies, which is supporting market growth.
Brazil dominates the Latin American market due to its large economy and growing IT sector. A unique growth factor is the increasing adoption of digital banking and financial services, which require reliable IT infrastructure and dependency mapping tools to ensure performance and security.
Competitive Landscape
The Application Dependency Mapping Tool Market is moderately competitive, with several global and regional players offering a wide range of solutions. Companies are focusing on product innovation, strategic partnerships, and mergers and acquisitions to strengthen their market position. The market is characterized by continuous technological advancements, particularly in AI and cloud integration.
One of the leading players in the market is ServiceNow, which has established a strong presence through its comprehensive IT operations management solutions. The company recently introduced enhanced AI-driven capabilities in its dependency mapping tools to improve automation and analytics. Other key players are also investing in research and development to introduce advanced features and expand their product portfolios. The competitive environment is expected to intensify as new entrants and emerging technologies reshape the market landscape.
Key Players List
- ServiceNow
- BMC Software
- Dynatrace
- AppDynamics
- Micro Focus
- SolarWinds
- Device42
- LogicMonitor
- Datadog
- IBM
- Microsoft
- Cisco Systems
- Riverbed Technology
- ManageEngine
- Broadcom
Recent Developments
- In 2025, ServiceNow launched an upgraded dependency mapping solution with enhanced AI capabilities for predictive analytics and automation.
- In 2024, Dynatrace introduced a cloud-native mapping platform designed to support Kubernetes and microservices environments.
- In 2025, IBM expanded its IT operations portfolio by integrating dependency mapping features into its hybrid cloud management platform.
Application Dependency Mapping Tool Market Segments
Type
- Agent-Based Tools
- Agentless Tools
Deployment Mode
- On-Premise
- Cloud-Based
End-Use
- IT & Telecommunications
- BFSI
- Healthcare
- Retail
- Manufacturing
By Region
- North America
- Europe
- APAC
- Middle East and Africa
- LATAM