Cash Back and Rewards App Market Size, Share & Trends Analysis Report By Platform (Android, iOS), By Reward Type (Cash Back, Points & Gift Cards, Coupons & Discounts), By Application (Retail & E-commerce, Grocery, Restaurants & Food Delivery, Fuel & Mobility, Travel & Hospitality, Other Applications), By End User (Individual Consumers, Families & Households, Small Businesses) and By Region (North America, Europe, Asia-Pacific, Latin America, Middle East & Africa) Forecasts, 2026–2034
USD 3950
Cash Back and Rewards App Market Size
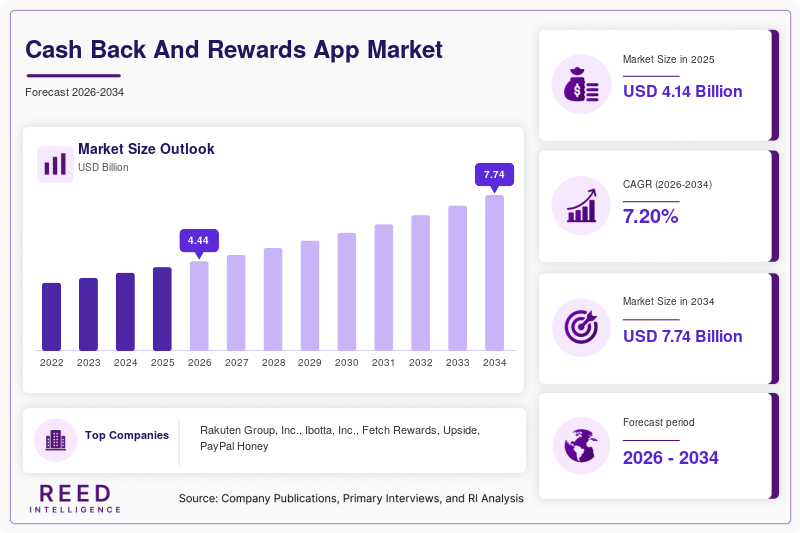
The global cash back and rewards app market was valued at USD 4.14 billion in 2025 and is projected to grow from USD 4.44 billion in 2026 to USD 7.73 billion by 2034, registering a CAGR of 7.20% during the forecast period from 2026 to 2034.
Cash back and rewards apps are evolving from simple coupon-distribution tools into transaction platforms connecting consumers, retailers, brands, payment providers, and affiliate networks. The commercial model depends on converting consumer purchase activity into measurable value for participating merchants and brands. Ibotta, for example, distributes digital promotions through its own app, website and browser extension as well as third-party platforms operated by retailers and other publishers. Its 2025 filing reported more than 54 million registered users and relationships with more than 900 clients representing over 3,100 consumer packaged goods brands.
The market is also moving toward personalization. Upside reported that its offers reached 35 million U.S. consumers and 100,000 retailers in 2025, while its users collectively earned more than USD 1 billion in cash back since the company's founding. Restaurant transactions on the platform increased 64% year over year in July 2025, showing how reward mechanisms can be extended beyond conventional online shopping.
Cash Back and Rewards App Market Drivers
Personalized Offers Convert Consumer Purchase Data Into Measurable Promotional Value
Cash back platforms are increasingly using purchase, transaction and retailer data to match offers with consumer behavior. Ibotta's technology platform processes purchase, redemption, product, inventory and user information to operate campaigns and rewards, while its 2025 LiveLift capabilities were designed to help brands measure incremental sales and cost per incremental dollar.
The market mechanism is a shift from broad discounting toward targeted incentives. When a consumer receives an offer relevant to an intended purchase, the reward can influence retailer selection, product choice or purchase frequency while giving the advertiser a measurable transaction outcome.
This particularly benefits grocery, consumer packaged goods, restaurants and fuel-related applications where purchases occur frequently. The counterbalance is data-governance complexity: reward applications that collect detailed behavioral or location information must clearly communicate how that information is used. The FTC's action involving InMarket illustrates the regulatory sensitivity surrounding location data collected through shopping-rewards applications.
Retailers and Brands Are Increasingly Using Rewards as Performance-Based Marketing
The connection between rewards and completed transactions gives brands an alternative to conventional advertising. Ibotta reported that its network works with CPG brands and retailers through digital promotions distributed across direct and third-party properties, while clients pay based on promotional outcomes.
The commercial mechanism is important because marketing expenditure becomes more closely associated with measurable purchasing activity. Retailers can use rewards to attract new customers, encourage repeat visits and increase basket activity, while brands can promote particular products without relying entirely on broad media campaigns.
Upside's 2025 results provide another example: the company reported more than USD 250 million in cash back earned by consumers during 2025 and highlighted increased activity in grocery and restaurant categories.
The constraint is that merchants must balance the incremental sales generated by an offer against the cost of the reward and the possibility that consumers would have made the purchase without an incentive.
Mobile and Embedded Rewards Are Expanding the Number of Transactions Eligible for Incentives
Rewards are increasingly being integrated into retailer apps, browser extensions, payment platforms and other digital environments rather than requiring consumers to visit a standalone rewards website. Ibotta provides white-label technology to third-party publishers, while PayPal integrates rewards and Honey shopping functionality into its broader payments ecosystem.
This expands the number of points at which rewards can be presented during the shopping journey. PayPal Honey, for example, searches for available coupon codes during checkout and provides access to eligible rewards across thousands of shopping sites.
The mechanism supports higher offer visibility and reduces the friction associated with manually searching for discounts. The counterbalance is platform competition: rewards providers must secure merchant relationships, maintain competitive offers and prevent users from migrating between applications based solely on temporary promotional rates.
Cash Back and Rewards App Market Restraints
Reward Economics Can Limit Platform and Merchant Margins
Cash back apps must divide the economic value generated by an eligible transaction among consumers, merchants, brands, affiliate networks and the platform. Ibotta's filings describe competition from retailer loyalty programs, digital coupon providers, online shopping sites and other rewards applications.
The resulting mechanism creates pressure to demonstrate incremental value. If a reward simply subsidizes purchases that consumers would have made anyway, the merchant's promotional efficiency can decline. Platforms therefore need reliable attribution, fraud controls and campaign measurement to justify reward spending.
Large networks can offset this constraint by aggregating more merchants and consumers, but smaller providers may face greater pressure from customer acquisition and offer-sourcing costs.
Privacy, Data Governance and Fraud Requirements Increase Operating Complexity
Cash back applications can process detailed information about purchases, receipts, locations and consumer behavior. Ibotta states that its technology platform processes purchase and redemption data, while the FTC's 2024 action against InMarket highlighted concerns over the use of location information collected through shopping-rewards applications.
The market mechanism is higher compliance and technology expenditure. Platforms must obtain appropriate consent, communicate data practices and maintain safeguards against misuse while also detecting fraudulent transactions and duplicate reward claims.
These requirements can increase operating costs and restrict some forms of data monetization. They can also affect product design when platforms expand from simple coupon applications into more personalized financial or shopping services.
Cash Back and Rewards App Market Opportunities
White-Label Rewards Infrastructure Expands the Addressable Merchant Base
An important opportunity is providing rewards infrastructure directly to retailers, marketplaces, delivery platforms and financial applications instead of relying only on a standalone consumer brand.
Ibotta already operates this model through its Performance Network, where third-party publishers including Walmart, Dollar General and Instacart use Ibotta-powered offers within their own digital environments.
The commercial opportunity comes from embedding rewards where consumers already shop. This can reduce customer-acquisition friction while allowing merchants to retain their own customer relationship and brand identity.
The main adoption barrier is integration complexity. Retailers need reliable APIs, transaction matching, offer validation, settlement and fraud controls before deploying third-party rewards infrastructure at scale.
Offline Commerce Creates Room for Location-Based and Transaction-Linked Rewards
A large opportunity exists beyond online retail because fuel, grocery, restaurant and other physical purchases occur frequently and can support recurring reward engagement. Upside reported that its marketplace reached 100,000 retailers across fuel, convenience, food and hardware categories and that users earned more than USD 1 billion in cumulative cash back.
The mechanism is increased frequency: consumers can use an application repeatedly for routine purchases rather than only during occasional online shopping events.
Location-based offers, card-linked transactions and instant reward settlement can further reduce redemption friction. However, privacy restrictions and merchant integration requirements can limit the amount of transaction data that platforms can use for personalization.
Platform Analysis
By Platform
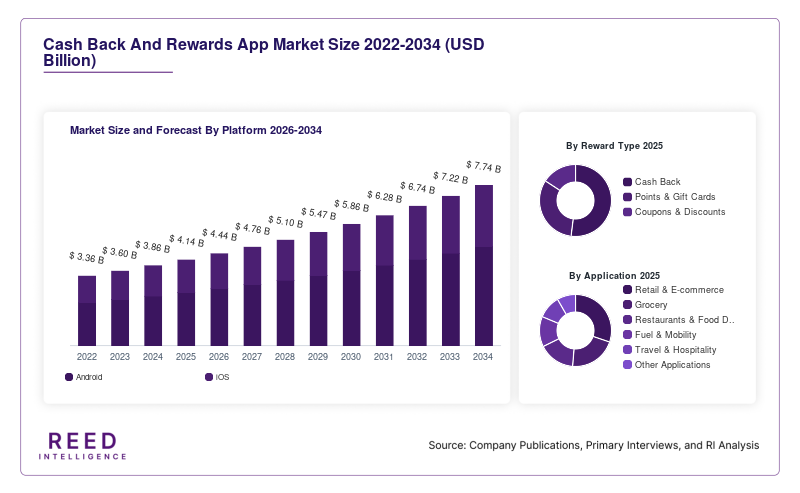
Android accounted for approximately 58% of the platform segment in 2025. Its larger installed-device base provides rewards providers with broad reach across price tiers and consumer groups. The platform is particularly relevant to applications targeting everyday spending, where users can receive offers, upload receipts, monitor balances and redeem rewards from a mobile device.
The importance of mobile distribution is demonstrated by Ibotta, whose consumer proposition is built around a mobile application complemented by web and browser-extension access. As of December 2025, Ibotta reported more than 54 million registered users for its app.
The remaining iOS segment is projected to grow at approximately 6.7% CAGR through 2034, supported by high engagement among digitally active consumers and continued integration of rewards with shopping and payment applications.
iOS accounted for approximately 42% of the platform segment in 2025 and is projected to grow at approximately 7.8% CAGR through 2034. Its opportunity is linked to strong integration between shopping, payment and consumer-finance applications, although platform policies and app-store requirements can influence distribution economics.
Reward Type Analysis
By Reward Type
Cash Back accounted for approximately 52% of the reward-type segment in 2025. Cash rewards provide a direct and easily understood economic benefit, reducing the complexity associated with points conversion and redemption.
Ibotta's model is centered on cash back from eligible purchases, with consumers able to withdraw qualifying balances through payment accounts, bank accounts or digital gift cards. The company reported more than USD 2.7 billion in cumulative cash back credited to redeemers by the end of 2025.
The straightforward value proposition supports frequent-use categories such as grocery, fuel and restaurants.
Points & Gift Cards accounted for approximately 28% of the reward-type segment in 2025 and are projected to grow at approximately 8.4% CAGR through 2034. This segment benefits from integration with payment ecosystems and retailers where points can be used for future purchases or converted into gift cards.
PayPal's rewards structure illustrates the model, allowing eligible points to be applied toward purchases, exchanged for rewards or donated.
Coupons & Discounts accounted for approximately 20% of the segment and are projected to grow at approximately 5.9% CAGR through 2034.
Application Analysis
By Application
Retail & E-commerce accounted for approximately 34% of the application segment in 2025. The segment benefits from established affiliate-commerce infrastructure, digital checkout processes and the ability to connect promotional offers directly with online transactions.
Browser extensions and shopping applications can identify discounts while consumers are completing purchases. PayPal Honey, for example, automatically searches for eligible coupon codes during checkout and can provide rewards on participating purchases.
Restaurants & Food Delivery accounted for approximately 17% of the application segment in 2025 and is projected to grow at approximately 9.1% CAGR through 2034. High purchase frequency gives restaurants more opportunities to use rewards to influence visit frequency and customer retention.
Upside reported a 64% year-over-year increase in restaurant transactions in July 2025, while expanding its marketplace into grocery and restaurant categories.
Grocery accounted for approximately 22% of the application segment and is projected to grow at approximately 7.4% CAGR. Fuel & Mobility represented approximately 14% and is projected to grow at approximately 6.5%, while Travel & Hospitality and Other Applications represented approximately 7% and 6%, respectively, with projected CAGRs of approximately 6.8% and 6.1%.
End-User Analysis
By End User
Individual Consumers accounted for approximately 67% of the end-user segment in 2025. The segment is supported by the straightforward proposition of reducing the effective cost of routine purchases.
Large reward networks demonstrate the scale possible when consumers can earn incentives across multiple merchants. Upside reported access to 35 million American consumers in 2025, while Fetch reported 12.5 million monthly active users in late 2024.
Families & Households accounted for approximately 23% of the end-user segment in 2025 and are projected to grow at approximately 8.1% CAGR through 2034. The mechanism is the concentration of recurring household expenditure across groceries, fuel, restaurants, household goods and online retail.
Small Businesses accounted for approximately 10% of the segment and are projected to grow at approximately 5.6% CAGR through 2034.
Cash Back and Rewards App Market Regional Analysis
North America Represents the Largest Regional Market
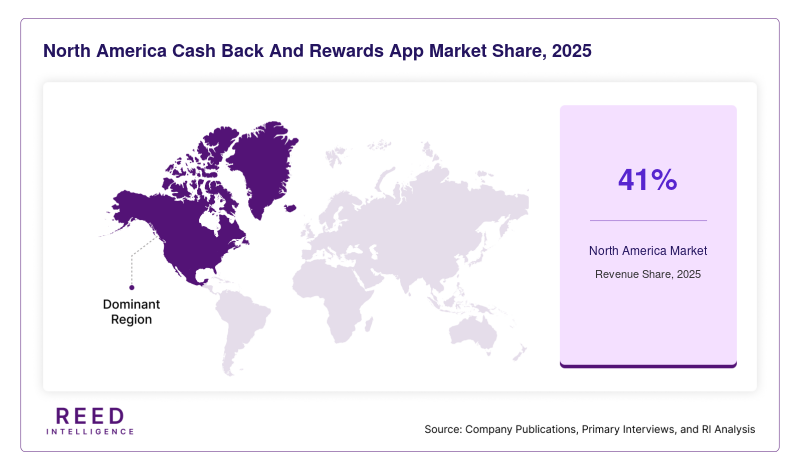
North America accounted for approximately 41% of global revenue in 2025. The region benefits from mature digital-commerce infrastructure, extensive retailer loyalty programs, established affiliate marketing networks and a large ecosystem of cash back applications.
Ibotta reported more than 54 million registered users at the end of 2025 and relationships with more than 900 clients representing over 3,100 CPG brands. Fetch reported 12.5 million monthly active users in late 2024, while Upside reported that its offers reached 35 million American consumers in 2025.
The market mechanism is the convergence of retail promotions, mobile applications and transaction-level marketing. Grocery and everyday retail provide particularly frequent opportunities for rewards redemption.
The United States is the principal market, supported by large-scale CPG advertising budgets and extensive retailer networks. Canada provides an additional established market with developed e-commerce and loyalty infrastructure.
The main constraints include high customer-acquisition costs, competition among reward applications, privacy requirements and pressure to prove that rewards generate incremental purchases rather than simply subsidizing existing demand.
Asia-Pacific Is the Fastest-Growing Regional Market
Asia-Pacific accounted for approximately 25% of global revenue in 2025 and is projected to grow at approximately 8.4% CAGR through 2034. Mobile commerce adoption, expanding digital payments and the increasing use of app-based loyalty programs create a broad base for rewards applications.
The market mechanism differs across countries but generally involves linking discounts and incentives with mobile commerce and digital payment activity. Large populations of smartphone users create room for platforms that aggregate retailer offers and personalize rewards.
China, India, Japan, South Korea and Southeast Asian markets represent important country-level opportunities, although the competitive environment and payment infrastructure differ substantially.
The primary limitation is market fragmentation. Local payment ecosystems, retailer structures, data regulations and consumer preferences can require country-specific partnerships and technology integration.
Europe Maintains a Mature Rewards Ecosystem
Europe accounted for approximately 19% of global revenue in 2025 and is projected to grow at approximately 6.6% CAGR through 2034. Demand is supported by established e-commerce, retailer loyalty schemes and consumer familiarity with digital discounts.
The commercial opportunity is increasingly connected to personalized offers and cross-retailer shopping platforms. However, privacy regulation and fragmented national markets require platforms to adapt data practices and commercial partnerships to local conditions.
The United Kingdom, Germany and France represent major addressable markets, while other European countries provide additional opportunities through localized retailer and payment relationships.
Latin America Expands Through Digital Commerce and Mobile Payments
Latin America accounted for approximately 9% of global revenue in 2025 and is projected to grow at approximately 7.5% CAGR through 2034. Mobile-first commerce and expanding digital-payment adoption create opportunities for rewards providers to reach consumers without extensive physical infrastructure.
Brazil and Mexico provide significant opportunities because of their large consumer markets and growing digital financial ecosystems. The main commercial mechanism is the integration of rewards into payment, retail and e-commerce journeys.
Currency volatility, uneven digital infrastructure and differences in consumer purchasing power can affect reward economics and platform adoption.
Middle East & Africa Remain Smaller but Digitally Expanding Markets
Middle East & Africa accounted for approximately 6% of global revenue in 2025 and are projected to grow at approximately 6.9% CAGR through 2034. Adoption is concentrated in markets with higher smartphone penetration, developed digital-payment infrastructure and organized retail sectors.
The United Arab Emirates, Saudi Arabia and South Africa provide important opportunities for merchant-funded rewards and digital loyalty services.
The principal constraints are differences in payment infrastructure, consumer behavior, regulatory frameworks and merchant digitization across countries.
Cash Back and Rewards App Market Competitive Landscape
Competition is shaped by the ability to aggregate consumers and merchants while maintaining sufficient reward economics. Platforms compete through offer breadth, merchant coverage, personalization, user experience, payout flexibility, retailer integrations and data-driven campaign measurement.
Ibotta operates both a direct-to-consumer application and a white-label infrastructure model. Its network connects CPG brands with consumers through third-party publishers including Walmart, Dollar General and Instacart.
Rakuten uses an affiliate-commerce model in which merchants pay Rakuten for referred shoppers and a portion of the economics is returned to consumers as cash back. Rakuten states that its members have received more than USD 3.6 billion in cash back and that its community exceeds 21 million members.
Key Market Players
- Rakuten Group, Inc.
- Ibotta, Inc.
- Fetch Rewards
- Upside
- PayPal Honey
- RetailMeNot
- Capital One Shopping
- Shopkick
- Swagbucks
- TopCashback
- MyPoints
- Receipt Hog
- CoinOut
- Travelzoo
- Groupon
Cash Back and Rewards App Market Recent Developments
- Ibotta introduced LiveLift in 2025 to provide brands with additional capabilities for measuring incremental sales and cost per incremental dollar. The company also expanded its publisher network and reported relationships with more than 900 clients representing more than 3,100 CPG brands at the end of 2025.
- Upside announced in August 2025 that its users had collectively earned more than USD 1 billion in cash back. The platform had reached 35 million American consumers and 100,000 retailers, while restaurant transactions increased 64% year over year in July 2025.
Cash Back And Rewards App Market Segments
By Platform
- Android
- iOS
By Reward Type
- Cash Back
- Points & Gift Cards
- Coupons & Discounts
By Application
- Retail & E-commerce
- Grocery
- Restaurants & Food Delivery
- Fuel & Mobility
- Travel & Hospitality
- Other Applications
By End User
- Individual Consumers
- Families & Households
- Small Businesses
By Region
- North America
- Europe
- APAC
- Middle East and Africa
- LATAM