Electronic Gaming Machine Market Size, Share & Trends Analysis Report By Machine Type (Video Slot Machines, Video Lottery Terminals, Video Gaming Terminals), By Deployment Model (Outright Purchase, Revenue-Sharing and Gaming Operations/Lease), By End User (Casinos, Commercial Gaming Venues, Tribal and Regional Gaming Operators) and By Region (North America, Europe, APAC, Middle East and Africa, LATAM) Forecasts, 2026–2034
USD 3950
Electronic Gaming Machine Market Size
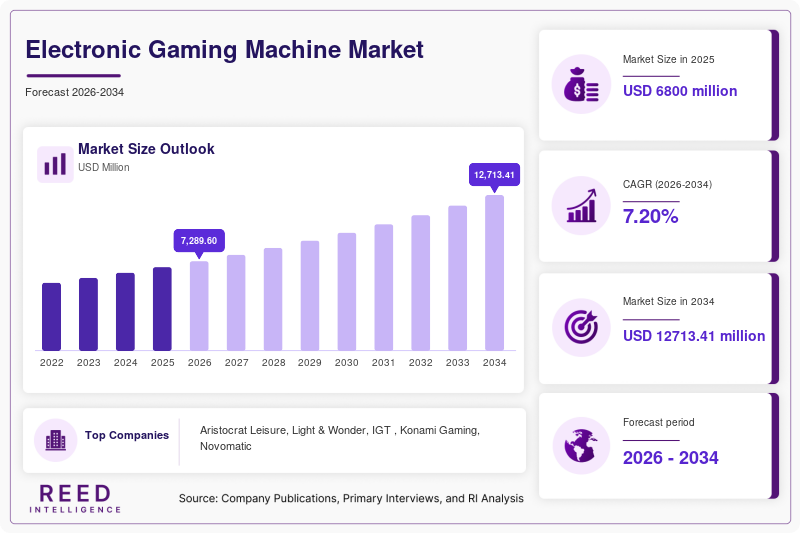
The global Electronic Gaming Machine Market was valued at USD 6,800 million in 2025 and is estimated to reach USD 7,290 million in 2026. Based on the supplied forecast, the market is projected to reach USD 12,713.41 million by 2034. The user-provided CAGR is 7.20% for the 2026–2034 forecast period.
The supplied 2026 and 2034 market values imply a CAGR of approximately 6.54% over eight years. The 2025 and 2034 values imply approximately 6.60% over nine years. These endpoints do not mathematically reconcile with the stated 7.20% CAGR. This report retains the supplied values and identifies the difference rather than substituting a new forecast. Segment and regional allocations are internal analytical models, not externally published market estimates.
Electronic gaming machines are electronic devices that allow players to participate in regulated games of chance or other approved gaming formats in physical venues. The market includes video slot machines, video lottery terminals (VLTs), video gaming terminals and related electronic gaming hardware. Depending on the commercial arrangement, supplier revenue can come from equipment sales, recurring gaming operations, leasing, maintenance, content and systems services.
The market’s commercial structure is broader than one-time hardware sales. Suppliers can sell a cabinet directly to an operator or retain ownership and earn recurring revenue through a revenue-sharing or gaming-operations arrangement. Light & Wonder’s 2025 results separately reported gaming machine sales and gaming operations revenue, illustrating how the two models contribute differently to supplier performance. These business lines should not be treated as interchangeable when estimating hardware demand.
Demand is closely linked to the number and performance of licensed gaming venues, new venue openings, floor expansions, replacement cycles, game performance and local rules governing permitted machine types. Regulatory approval is particularly important because a machine or game certified for one jurisdiction may not be permitted in another. This increases compliance costs and can lengthen the interval between product development and commercial deployment.
Electronic Gaming Machine Market Drivers
Replacement demand and premium cabinet upgrades support equipment sales
Gaming venues periodically replace older machines to refresh game content, improve cabinet performance and maintain the appeal of their gaming floors. The business opportunity is not limited to net new machines: replacement units can represent a substantial part of annual shipments. Light & Wonder reported 22,506 replacement units shipped in the United States and Canada during 2025, compared with 1,738 units associated with casino openings and expansions in those markets. This company-specific disclosure demonstrates why replacement demand is an important procurement channel, although it should not be generalized into a global market share.
Recurring gaming-operations contracts expand the monetization model
Gaming-operations contracts can support suppliers through recurring revenue rather than relying exclusively on new equipment sales. Operators may prefer this model when they want to preserve capital or when a supplier can demonstrate a strong track record of game performance. For suppliers, the model can increase the value of an installed base but requires capital investment, field servicing and exposure to fluctuations in venue-level gaming revenue. Growth therefore depends on the profitability of deployed units, not simply the number of machines placed.
Gaming revenue and venue investment influence machine procurement
Machine purchases are ultimately tied to the economics of licensed gaming venues. In Nevada, official regulatory statistics track taxable revenue from slot machines separately from table games, illustrating the importance of machine-level performance to casino operations. When operators see sustained machine revenue and have the capital to invest, they may replace equipment, add premium cabinets or expand capacity. However, venue revenue is not the same as machine-equipment market revenue: it is an indicator of operator economics, not a direct measure of supplier sales.
Electronic Gaming Machine Market Restraints
Regulatory approvals and jurisdiction-specific requirements increase costs
Electronic gaming machines operate within tightly regulated environments. Certification, approved game content, technical standards, testing and licensing requirements differ across jurisdictions. Manufacturers may need to adapt hardware or software, maintain documentation and undergo approval processes before selling into a new market. These requirements can raise product-development costs and delay revenue recognition, particularly for suppliers targeting several regulatory markets with different technical requirements.
Capital expenditure and venue economics can delay upgrades
Even when a new machine offers improved features, operators must compare its cost with the expected return from the existing floor. A replacement may be deferred if the venue is facing weaker gaming revenue, higher operating costs or competing capital requirements. In revenue-sharing arrangements, the supplier may absorb more of the upfront cost, making returns sensitive to utilization, machine performance and contract duration.
Competition for player attention raises the bar for game performance
Electronic gaming machines compete with other casino activities and, where legal, digital gaming alternatives for player time and spending. A hardware refresh alone may not be sufficient to persuade an operator to replace a machine. Suppliers need appealing game content, reliable systems and evidence that a new cabinet or title can improve performance. This can make content development and portfolio management as important as physical hardware innovation.
Electronic Gaming Machine Market Opportunities
Premium installed-base growth creates recurring-revenue potential
Premium machines can provide suppliers with an opportunity to expand recurring gaming-operations revenue when operators prefer to pay through a revenue-sharing model. Light & Wonder reported continued growth in its North American premium installed base in its 2025 results, showing that suppliers are actively expanding this model. Commercial success nevertheless depends on the performance of deployed titles, contract economics and the cost of financing and servicing the installed base.
New gaming venues and legalized formats can create addressable demand
Where new casinos, regional gaming venues or approved video gaming formats enter operation, operators may require new equipment and supporting systems. The size of the opportunity depends on the number of licenses, permitted machine counts, venue investment and the timing of regulatory approvals. Market entry should therefore be assessed jurisdiction by jurisdiction rather than assuming that gaming legalization automatically translates into immediate equipment orders.
Hardware, content and systems integration can deepen supplier relationships
Suppliers can differentiate themselves through integrated offerings that combine cabinets, game libraries, casino management systems, monitoring and service support. Integrated solutions may simplify deployment for operators and support longer commercial relationships. However, integration can also increase switching costs and make operators more dependent on a limited number of technology vendors, so reliability, cybersecurity and vendor support remain important procurement considerations.
Segmental Analysis
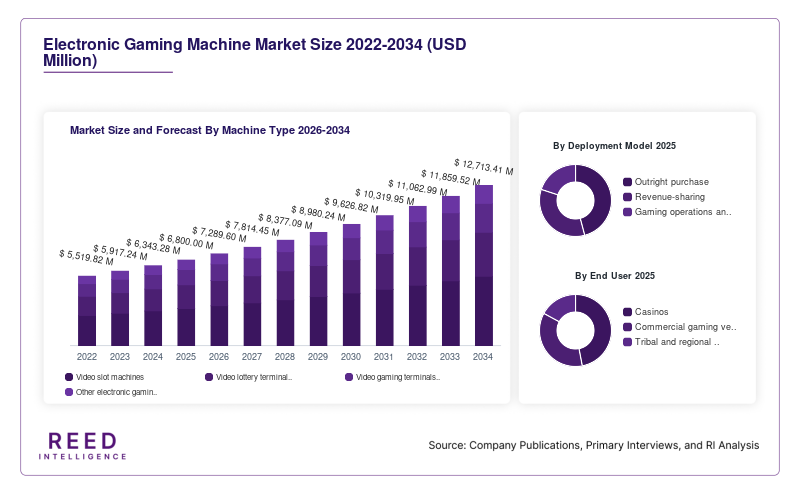
Important methodology note: the segment shares and indicative values below are internal analytical allocations developed for this report. They are not market shares published by regulators or equipment manufacturers. The allocations are designed to provide a structured view of the supplied global market value; they should be refined when comparable, machine-specific supplier or shipment data become available. Values are expressed in USD million.
By Machine Type
Video slot machines are modeled as the largest category, accounting for approximately 60% of the 2025 market, equivalent to about USD 4,080 million under this internal allocation. Their modeled share reflects their established role in casino floors and the presence of recurring replacement and premium-machine programs. Demand is affected by cabinet upgrades, game performance and the investment plans of licensed operators.
Video lottery terminals represent an internally allocated 20% of the 2025 market, or approximately USD 1,360 million. Their commercial footprint depends on the jurisdictions that authorize lottery-linked or centrally monitored gaming terminals. Procurement can be influenced by public-sector contracting, operator agreements and the technical standards set for connected systems.
Video gaming terminals account for a modeled 12% of the 2025 market, equivalent to approximately USD 816 million. Their demand is linked to the availability of approved terminal-based gaming in bars, clubs, regional venues or other permitted locations. This category can be sensitive to local rules on venue eligibility, machine counts, payout structures and monitoring.
Other electronic gaming machines make up the remaining modeled 8% of the 2025 market, or approximately USD 544 million. This group includes machine formats that do not fit cleanly into the three main categories. Its performance depends on the mix of locally permitted formats and the degree to which operators adopt specialized or niche hardware.
By Deployment Model
Outright purchase represents an internally modeled 45% of the 2025 market, or about USD 3,060 million. In this model, operators purchase machines and generally carry the initial capital expenditure. Revenue for the supplier is more directly associated with equipment shipments, while repeat orders depend on replacement cycles, new venue openings and floor expansions.
Revenue-sharing accounts for a modeled 35% of the 2025 market, equivalent to approximately USD 2,380 million. The model can reduce the operator’s upfront cost and align supplier returns with the performance of deployed machines. It also shifts more investment and operating exposure to the supplier or route operator, making utilization and revenue per unit central to profitability.
Gaming operations and lease represent the remaining modeled 20% of the 2025 market, or approximately USD 1,360 million. This category captures arrangements in which machines are leased or operated under longer-term commercial agreements. The value of this model depends on contract structure and what is included in reported revenue; equipment-related recurring revenue should not be confused with total player wagers or venue gaming yield.
By End User
Casinos account for an internal allocation of 55% of the 2025 market, equivalent to approximately USD 3,740 million. Casinos typically procure machines through a combination of direct purchase, replacement programs and recurring gaming-operations contracts. Their investment decisions depend on floor performance, visitor volumes, machine utilization and the return available from new cabinets or game titles.
Commercial gaming venues represent a modeled 20% of the 2025 market, or approximately USD 1,360 million. This category includes non-casino commercial venues where electronic gaming machines are legally authorized. Demand is shaped by local operating permissions, venue economics and the extent to which machine-based gaming forms part of the venue’s revenue model.
Tribal and regional gaming operators account for an internally modeled 15% of the 2025 market, equivalent to approximately USD 1,020 million. Their procurement may be tied to facility modernization, regional competition, new capacity and replacement of older equipment. Actual opportunities vary substantially by jurisdiction, ownership structure and permitted gaming activity.
Other authorized venues account for the remaining modeled 10% of the 2025 market, or approximately USD 680 million. The category captures smaller or specialized deployment environments that meet the report’s scope. Its size is particularly sensitive to how individual countries define authorized venues and which terminal types are included in their regulatory frameworks.
Regional Analysis
North America Electronic Gaming Machine Market
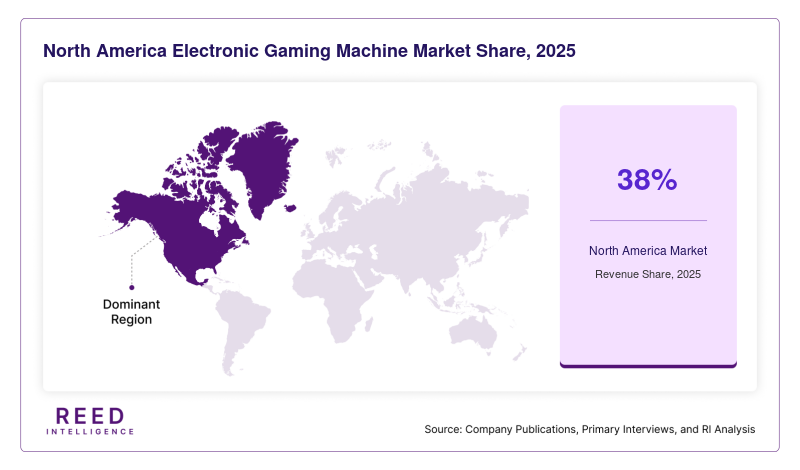
North America is modeled as the largest regional market in 2025, with a 38% share valued at approximately USD 2,584 million. By 2034, its modeled share is 36%, equivalent to approximately USD 4,356 million. The region’s established casino industry, sizeable installed base and active replacement market support this allocation. Light & Wonder reported 22,506 replacement units shipped in the United States and Canada in 2025, along with 1,738 units for casino openings and expansions. This supports the importance of refresh demand, although the company’s shipments should not be interpreted as total regional shipments or market share.
The region’s outlook depends on casino capital expenditure, regional gaming policies, machine performance and competition among operators. Regulatory approval and jurisdiction-specific technical requirements remain important barriers to rapid product rollout. Premium gaming-operations arrangements may support recurring supplier revenue, although profitability depends on the economics of each installed machine.
Europe Electronic Gaming Machine Market
Europe is allocated a modeled 24% of the global market in 2025, representing approximately USD 1,632 million. By 2034, its modeled share is 23%, corresponding to approximately USD 2,783 million. The region’s electronic gaming machine market is shaped by varied national gambling frameworks and differences between casino, betting-shop and other authorized machine environments. The UK Gambling Commission reported £2.6 billion in gross gambling yield from gaming machines in Great Britain for April 2024 to March 2025, up 2.9% from the preceding financial year. This indicates substantial machine-based gambling activity in Great Britain, but it is not a direct measure of equipment sales or the whole European market.
Regional demand depends on the number and type of licensed venues, machine limits, replacement requirements and rules governing approved games. Suppliers entering new European markets must account for national differences in certification, monitoring and operating conditions. Regulatory familiarity and established operator relationships can therefore be meaningful competitive advantages.
Asia-Pacific Electronic Gaming Machine Market
Asia-Pacific (APAC) is modeled at 22% of the global market in 2025, equivalent to approximately USD 1,496 million. Its modeled share increases to 25% by 2034, representing approximately USD 3,025 million. The allocation reflects the region’s mix of established gaming destinations and markets with developing or more restrictive regulatory frameworks. Opportunities can arise from casino-floor refreshes, venue expansion and demand for premium gaming experiences, but APAC should not be treated as a uniform market. Licensing rules, local approval processes, tourism conditions and capital investment cycles differ materially across countries and territories.
For suppliers, a successful regional strategy requires a clear understanding of which jurisdictions permit the relevant machine formats and how local operators source equipment. The modeled increase in regional share is an analytical scenario, not a published regional equipment-sales forecast. Actual performance will depend on licensed capacity, supplier access and investment decisions in each market.
Middle East and Africa Electronic Gaming Machine Market
The Middle East and Africa region is modeled at 9% of the global market in 2025, or approximately USD 612 million. Its modeled 2034 share remains 9%, equivalent to approximately USD 1,089 million. The region has a heterogeneous regulatory landscape, and the addressable electronic gaming machine market depends on the jurisdictions that authorize relevant forms of gaming. Where permitted gaming venues are established or expanded, machine procurement can create opportunities for equipment suppliers and systems providers. However, the outlook remains highly sensitive to licensing, local law and the timing of approved developments.
A market assessment should distinguish confirmed operating venues from announced projects and should not assume that tourism growth alone will translate into electronic gaming machine demand. Suppliers must also account for service coverage, local partnerships, technical approvals and the practical cost of maintaining machines across geographically dispersed venues.
Latin America Electronic Gaming Machine Market
Latin America (LATAM) is allocated 7% of the global market in 2025, representing approximately USD 476 million. By 2034, its modeled share remains 7%, equivalent to approximately USD 847 million. The region’s market potential depends on the regulatory status of casinos and other machine-based gaming formats in individual countries. Where authorized venues invest in floor modernization, electronic gaming machine suppliers can benefit from equipment replacement and new deployments. Currency volatility, access to financing and changes in gambling regulation may affect procurement timing and the commercial terms operators can support.
For suppliers, regional opportunities are best evaluated through the pipeline of licensed venues, approved machine formats and the financial health of local operators. A country-level assessment is more reliable than applying a single regional growth assumption across markets with different rules and investment conditions.
Competitive Landscape
The electronic gaming machine industry combines hardware development, game design, regulatory compliance, distribution, field service and recurring gaming-operations capabilities. Competition is therefore not determined solely by the price of a cabinet. Suppliers also compete on the performance of their game portfolios, the reliability of installed equipment, the ability to obtain approvals and the economics they can offer casino and venue operators.
An important competitive distinction is the balance between outright machine sales and recurring operations revenue. Direct sales can produce revenue when units ship, while gaming-operations arrangements build revenue over time and require the supplier to invest in the installed base. Suppliers with strong content portfolios and operator relationships may be better positioned to secure floor space and repeat deployments, but outcomes depend on title performance, contract structure and jurisdictional access.
Supplier-reported financial figures should be interpreted carefully. Companies may report gaming operations, machine sales, systems, digital games and other activities in combined segments. For example, Light & Wonder reports several gaming-related revenue lines, while Aristocrat Leisure reports both gaming operations and outright sales within its wider gaming business. Those disclosures illustrate business-model diversity but do not provide directly comparable market shares for the narrowly defined global electronic gaming machine market.
Key Market Players
- Aristocrat Leisure
- Light & Wonder
- IGT
- Konami Gaming
- Novomatic
- Ainsworth Game Technology
- Everi
- Sega Sammy Creation
- Merkur Gaming
- Inspired Entertainment
Recent Market Developments
- August 2026: Light & Wonder’s second-quarter 2026 results reported a 5% year-over-year increase in gaming revenue to USD 554 million. Gaming operations revenue rose 18%, while gaming machine sales revenue declined 4%, primarily reflecting lower unit shipments and fewer new openings and expansions. The results illustrate how recurring operations and hardware shipments can move in different directions within the same reporting period. Market implication: suppliers with recurring operations revenue may be less dependent on new-machine shipments in any one quarter, although the mix and profitability of those revenue lines remain important.
- May 2026: Light & Wonder’s first-quarter 2026 disclosure included machine shipment and gaming operations metrics, providing another view of the relationship between new unit sales and deployed-machine performance. Such disclosures help track supplier momentum, but they should not be used alone to estimate the total global market because they cover one company and multiple gaming-related revenue lines. Market implication: investors and procurement teams should assess both shipment volumes and installed-base economics when evaluating supplier performance.
Electronic Gaming Machine Market Segments
By Machine Type
- Video slot machines
- Video lottery terminals (VLTs)
- Video gaming terminals (VGTs)
- Other electronic gaming machines
By Deployment Model
- Outright purchase
- Revenue-sharing
- Gaming operations and lease
By End User
- Casinos
- Commercial gaming venues
- Tribal and regional gaming operators
By Region
- North America
- Europe
- APAC
- Middle East and Africa
- LATAM