Global Labeling Services Market Size, Share & Trends Analysis Report By Service Type (Custom Labeling Solutions, Regulatory and Compliance Labeling, Others), By End Use (Food and Beverages, Pharmaceuticals, Consumer Goods, Chemicals and Industrial), By Country (North America, Europe, APAC, Middle East and Africa, LATAM) and Forecast, 2026-2034
USD 3950
Labeling Services Market Size
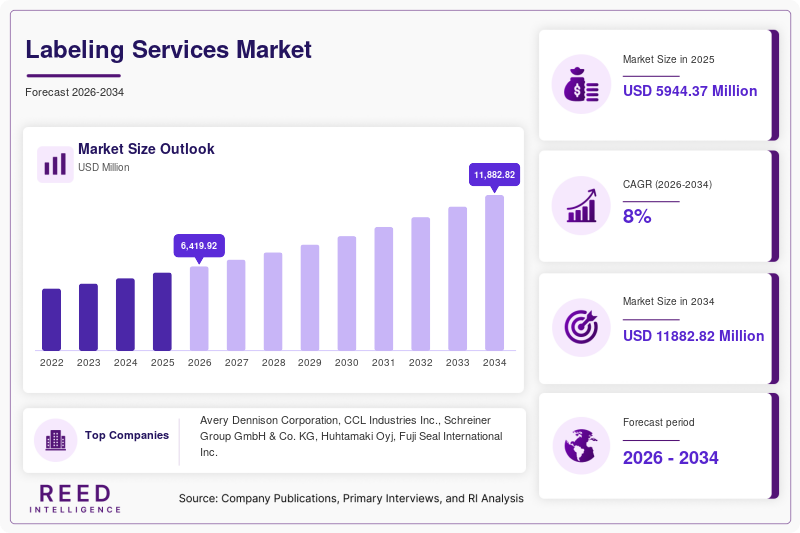
Global Labeling Services Market size is projected at USD 6,419.92 million in 2026 and is expected to hit USD 11,935.97 million by 2034 with a CAGR of 8%." The industry increases from USD 5,941.10 million in 2025, representing an approximately 8.06% year-on-year increase into 2026. The report evaluates service-type segmentation, end-use demand, geographic performance, technology shifts, regulatory requirements, and the competitive landscape.
Key Takeaways
- Dominant region: North America accounts for approximately 38.19% of 2026 revenue, at USD 2,451.74 million, and reaches USD 4,548.10 million by 2034 at an 8.03% CAGR.
- Fastest-growing region: Europe records the highest regional CAGR at 8.23%, expanding from USD 1,635.16 million in 2026 to USD 3,078.52 million in 2034.
- Dominant service: Custom Labeling Solutions contributes approximately 45.30% of 2026 service-type revenue and increases from USD 2,909.66 million to USD 5,596.55 million at an 8.52% CAGR.
- Fastest-growing service: Custom Labeling Solutions is also the fastest-growing supplied service category, with an 8.52% CAGR, versus 7.88% for Regulatory and Compliance Labeling.
- Emerging-country direction: India and China remain important Asia-Pacific expansion centers; the regional opportunity rises from USD 1,174.32 million in 2026 to USD 2,194.61 million by 2034 at an 8.13% CAGR.
The labeling services industry encompasses outsourced label design, artwork development, compliance management, variable-data printing, quality assurance, application, rework, and related product-identification activities. North America contributes 38.19% of the supplied 2026 regional total, Europe 25.47%, Asia Pacific 18.29%, Middle East and Africa 9.07%, and LATAM 8.97%. Within service types, Custom Labeling Solutions represent about 45.30% of the supplied 2026 total, Regulatory and Compliance Labeling approximately 34.79%, and Others approximately 19.90%. These figures demonstrate substantial penetration of customized and compliance-intensive workflows across packaged products, pharmaceuticals, chemicals, industrial goods, and consumer-facing applications.
Labeling Services Market Trends
Automation, Digital Printing and Intelligent Label Management Reshape Labeling Workflows
Labeling operations are moving from conventional static workflows toward digitally managed, automated, and increasingly intelligent systems. Commercial applications can involve millions of serialized identifiers and large batches of variable labels, while pharmaceutical and consumer-product organizations may maintain thousands of active SKUs across multiple languages and jurisdictions. RFID, QR codes, digital printing, structured-content systems, automated artwork management, and machine-readable identifiers are reducing revision cycles and enabling higher levels of traceability.
AI-assisted regulatory information management is another important shift. IQVIA introduced RIM Smart Labeling in 2023 to combine structured content, automated workflows, and regulatory intelligence for global label management. Food, pharmaceutical, consumer-goods, chemical, and industrial users increasingly require 100% SKU-level consistency, while digital workflows can process thousands or millions of variable records in production environments. Regulatory complexity and e-commerce are consequently increasing requirements for multilingual, traceable, rapidly updated labels.
Labeling Services Market Drivers
Regulatory Traceability and Expanding Packaged-Goods Volumes Accelerate Adoption
Regulatory requirements are increasing demand for accurate allergen declarations, pharmaceutical serialization, hazard communication, product identification, batch coding, and multilingual information. Labeling providers increasingly support 100% traceability objectives, thousands of SKUs, multiple regulatory jurisdictions, and production batches ranging from thousands to millions of labels. The combination of e-commerce expansion, global supply chains, product transparency, and barcode-based tracking strengthens outsourced labeling requirements; industry research also identifies packaged-goods expansion, traceability, regulatory requirements, and barcode adoption as major historical drivers.
Labeling Services Market Restraints
High Compliance Complexity and Repeated Artwork Changes Increase Operating Costs
Complex approval structures can restrain outsourcing economics because a single product may require multiple language versions, regulatory checks, artwork revisions, and SKU-specific validations. In regulated applications, providers frequently target accuracy approaching 100%, while even a 1% artwork or data error across a run of 1 million labels could affect 10,000 units. These requirements increase quality-control expenditure, turnaround pressure, validation workloads, and technology investment, particularly for smaller service providers managing hundreds or thousands of product variations.
Labeling Services Market Opportunities
Smart Labels and Automated Regulatory Platforms Expand Addressable Applications
Connected labels, RFID, dynamic QR codes, cloud artwork management, digital printing, and AI-assisted compliance create opportunities beyond conventional label production. A manufacturer operating 10,000 SKUs across 20 countries can potentially manage hundreds of thousands of SKU-market combinations, creating recurring requirements for content synchronization and validation. Smart-label infrastructure also supports item-level tracking across millions of units. In February 2026, Velocity Group International acquired Label Interactive Technologies to strengthen international carton and item-level labeling capabilities and improve supply-chain visibility.
Challenges in Global Labeling Services Market
Maintaining Accuracy Across High-Volume, Multilingual and Variable-Data Workflows
Providers must balance speed, accuracy, cybersecurity, sustainability, and regulatory consistency. Large enterprises can operate thousands of SKUs, dozens of languages, and label runs involving millions of variable codes. At 99% data accuracy, a 1-million-record workflow could theoretically contain 10,000 exceptions, illustrating why automated validation and human quality assurance remain important. Increasing customization also reduces standardization benefits and creates pressure to deliver shorter runs, faster turnaround, near-100% verification, and simultaneous regulatory updates.
Labeling Services Market Segmentation
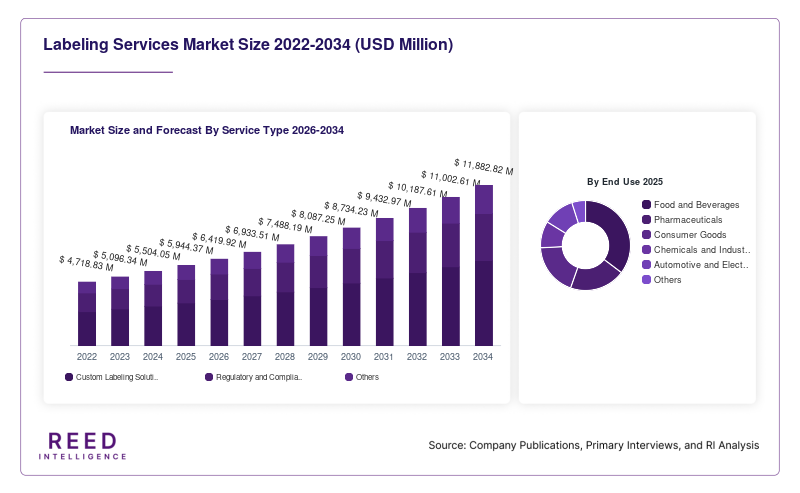
The industry is segmented by service type and end use. Custom Labeling Solutions dominate the supplied service dataset with approximately 45.30% of 2026 revenue, followed by Regulatory and Compliance Labeling at approximately 34.79% and Others at 19.90%.
By Service Type
Custom Labeling Solutions generated USD 2,681.22 million in 2025 and USD 2,909.66 million in 2026. The category is projected to reach USD 5,596.55 million by 2034, registering an 8.52% CAGR, the highest rate among the supplied service categories.
Regulatory and Compliance Labeling increases from USD 2,234.91 million in 2026 to USD 4,100.03 million in 2034 at a 7.88% CAGR, while Others advances from USD 1,278.52 million to USD 2,297.24 million at 7.60%. Custom solutions therefore remain both the largest and fastest-growing supplied subsegment.
By End Use
Food and Beverages, Pharmaceuticals, Consumer Goods, Chemicals and Industrial, Automotive and Electronics, and Others constitute the specified end-use structure. External industry evidence indicates Food and Beverages held more than 30.6% of industry revenue in 2024, while pharmaceutical applications were forecast to expand at approximately 8.1% CAGR in the referenced outlook.
Food labeling benefits from nutrition, allergen, origin, traceability, and branding requirements, while pharmaceutical applications require serialization, tamper evidence, multilingual content, and tightly controlled regulatory information. Consumer goods emphasize branding and customization; chemicals require hazard communication; and automotive and electronics applications increasingly use durable identification, barcodes, QR codes, and traceability labels.
Labeling Services Market Regional Outlook
North America
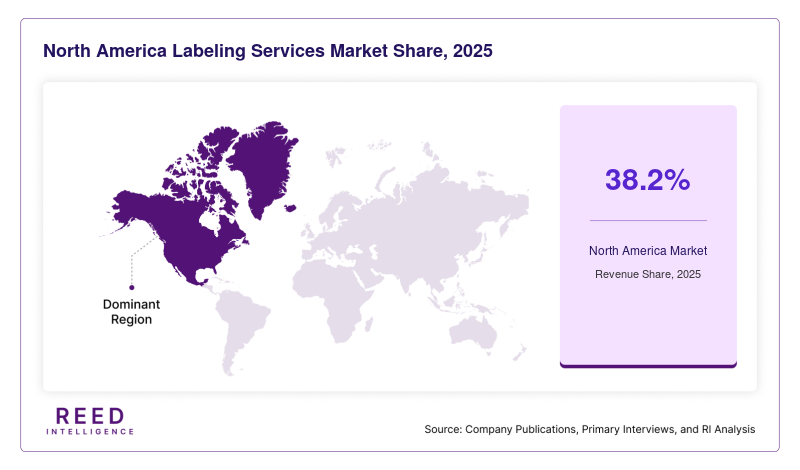
North America generates USD 2,451.74 million in 2026, equivalent to approximately 38.19% of the supplied global regional total. Revenue reaches USD 4,548.10 million by 2034 at an 8.03% CAGR. The United States represents the principal country contributor, supported by pharmaceutical, food, consumer-product, logistics, and industrial labeling requirements.
Europe
Europe contributes approximately 25.47% in 2026, with revenue of USD 1,635.16 million, rising to USD 3,078.52 million by 2034. Its 8.23% CAGR is the fastest among the supplied regions. Germany, the UK, France, Italy, and Spain contribute through pharmaceutical, food, chemical, industrial, and consumer-goods production.
APAC
Asia Pacific accounts for approximately 18.29% of 2026 revenue at USD 1,174.32 million and reaches USD 2,194.61 million in 2034 at an 8.13% CAGR. China, India, Japan, South Korea, Indonesia, and Taiwan support demand through manufacturing, electronics, pharmaceuticals, packaged food, e-commerce, and export-oriented production.
Middle East and Africa
Middle East and Africa represents approximately 9.07% of the supplied 2026 total, generating USD 582.61 million. The region reaches USD 1,068.81 million by 2034 at a 7.88% CAGR, supported by food imports and processing, pharmaceuticals, chemicals, consumer products, and expanding organized retail and logistics systems.
LATAM
LATAM contributes approximately 8.97% in 2026, with revenue of USD 576.09 million, increasing to USD 1,045.93 million by 2034 at a 7.74% CAGR. Brazil is a key country market, while packaged food, beverages, pharmaceuticals, consumer products, chemicals, and manufacturing provide major application bases.
Top players in Global Labeling Services Market
- Avery Dennison Corporation
- CCL Industries Inc.
- Schreiner Group GmbH & Co. KG
- Huhtamaki Oyj
- Fuji Seal International Inc.
- General Data Company Inc.
- Inland Packaging LLC
- Resource Label Group
- FineLine
- TransPerfect
- Celegence
- OnlineLabels LLC
- Topflight Corporation
- Label Technology Inc.
- Hub Labels Inc.
Top Two Companies
-
Avery Dennison Corporation: Exact standalone percentage contribution to labeling-services revenue is not publicly disclosed in the reviewed sources and therefore is not fabricated. The company is nevertheless consistently identified among major participants in industry coverage. Its competitive positioning reflects extensive materials science, identification, digital solutions, RFID, and global customer relationships. With labeling workflows increasingly targeting 100% item-level traceability and supporting production quantities extending into millions of identifiers, scale, automation, intelligent labels, and international service coverage provide meaningful competitive advantages.
-
CCL Industries Inc.: A precise percentage attributable exclusively to the defined labeling-services category is likewise not publicly disclosed in the reviewed evidence. CCL is identified as a major industry participant alongside Avery Dennison and other global providers. Its positioning benefits from broad labeling capabilities serving healthcare, consumer, industrial, and specialty applications. Demand increasingly involves thousands of SKUs, multiple substrates, serialized identifiers, and accuracy targets approaching 100%, favoring suppliers capable of combining large-scale production, technical specialization, regulatory capabilities, and geographic reach.
Recent Developments in Global Labeling Services Market
- 2026: Velocity Group International acquired Label Interactive Technologies, strengthening international carton and item-level labeling capabilities.
- 2025: Research into large-scale e-commerce relevance labeling demonstrated that LLM-based workflows can approach human-level labeling accuracy while reducing conventional annotation time and cost.
Labeling Services Market Segments
By Service Type
- Custom Labeling Solutions
- Regulatory and Compliance Labeling
- Others
By End Use
- Food and Beverages
- Pharmaceuticals
- Consumer Goods
- Chemicals and Industrial
- Automotive and Electronics
- Others
By Region
- North America
- Europe
- APAC
- Middle East and Africa
- LATAM