Phoropter Market Size, Share & Demand Report By Type (Digital Phoropters, Manual Phoropters), By End-User (Hospitals & Clinics, Optometry Centers, Eye Care Labs), By Distribution Channel (Medical Equipment Distributors, Direct Hospital Procurement, Online Sales Channels) By Region & Segment Forecasts, 2025–2034
USD 3950
Market Overview
The Phoropter Market size was valued at USD 780 million in 2024 and is projected to reach USD 1.42 billion by 2033, growing at a CAGR of 6.8% from 2025 to 2034. Phoropters are essential ophthalmic diagnostic instruments used for refractive assessments and prescription of corrective lenses. Increasing prevalence of vision disorders, coupled with rising eye care awareness and adoption of advanced diagnostic equipment, has bolstered market growth.
A key global factor supporting market expansion is the growing geriatric population worldwide. Age-related vision impairments such as myopia, hyperopia, astigmatism, and presbyopia have driven demand for advanced phoropters, especially automated and digital variants. The shift toward digital and automated phoropters enhances accuracy and patient throughput, further propelling adoption in clinics and hospitals.
Key Highlights
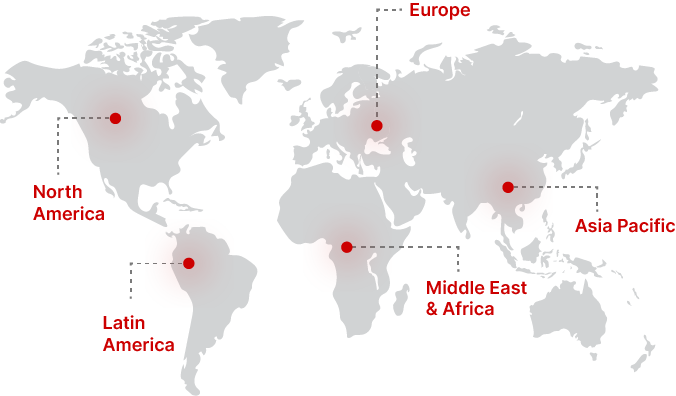
- North America dominated the market with 39.5% share in 2025, while Asia Pacific is projected to grow fastest at a CAGR of 7.4% during 2025–2034.
- By Type, Digital Phoropters led the market in 2024, while Manual Phoropters are expected to record the fastest CAGR of 7.1%.
- By End-User, Hospitals & Clinics dominated in 2024, whereas Optometry Centers will grow fastest with a CAGR of 7.2%.
- United States remained the largest market with USD 310 million in 2024 and USD 325 million in 2025.
Market Trends
Shift Toward Digital and Automated Phoropters
The Phoropter Marketis increasingly dominated by digital and automated instruments. Automated phoropters reduce examination time, improve accuracy, and provide integration with electronic medical record systems. Clinics and hospitals are upgrading to digital systems to enhance patient experience and streamline workflow.
Integration with Tele-optometry Platforms
Tele-optometry adoption allows remote eye examinations using connected phoropters. This trend is particularly strong in rural and underserved regions, enabling remote refractive assessments and virtual consultations, which broadens market accessibility and drives sales of phoropters with telemedicine-compatible features.
Market Drivers
Rising Prevalence of Vision Disorders
The increasing incidence of myopia, hyperopia, and age-related vision conditions is driving the Phoropter Market size. Ophthalmic practitioners require accurate diagnostic tools for precise prescription management, fueling demand for modern phoropters.
Technological Advancements in Ophthalmic Instruments
Advances in digital imaging, auto-refraction technology, and cloud-connected diagnostics support market growth. Enhanced accuracy, time efficiency, and integration with EMR systems encourage adoption of new phoropters in both established and emerging markets.
Market Restraint
High Cost of Digital Phoropters
High acquisition and maintenance costs of digital phoropters restrict adoption among small clinics and individual practitioners. Manual phoropters remain preferred in cost-sensitive markets, limiting overall market penetration.
Market Opportunities
Expansion in Emerging Economies
Emerging economies in Asia Pacific and Latin America offer significant growth potential due to increasing eye care awareness, expanding healthcare infrastructure, and government initiatives promoting ophthalmic health.
Integration of AI and Smart Diagnostics
Phoropters integrated with AI and smart analytics can automatically detect refractive errors and provide treatment recommendations. This innovation improves diagnostic precision and reduces examination time, creating opportunities for product differentiation and premium offerings.
Segmental Analysis
By Type
Digital phoropters accounted for 52.4% share in 2024, driven by their accuracy, speed, and integration with EMR systems.
Manual phoropters are projected to grow at 7.1% CAGRdue to affordability and durability in small clinics and emerging markets where cost remains a critical factor.
By End-User
Hospitals and clinics contributed 58.2% of market share in 2024, reflecting higher purchasing power and preference for advanced diagnostic equipment.
Optometry centers are expected to grow at 7.2% CAGR, driven by increasing standalone optometry practices, vision awareness campaigns, and adoption of portable digital phoropters.
By Distribution Channel
Medical equipment distributors and hospital procurement channels held 61.5% share in 2024, ensuring direct supply to large hospitals and clinics.
Online distribution of phoropters is expected to grow at 7.0% CAGR, supported by digital marketing, ease of procurement, and increased e-commerce adoption among private practices.
Regional Analysis
North America
North America held 39.5% of the global Phoropter Market in 2025. The region benefits from advanced healthcare infrastructure, high adoption of digital ophthalmic instruments, and strong awareness of vision health. Market growth is projected at 6.2% CAGR during 2025–2034.
The United Statesdominated the region due to extensive hospital networks, large patient base for refractive conditions, and early adoption of digital phoropters. Government programs supporting vision care and reimbursement policies for ophthalmic devices further drive market growth.
Europe
Europe accounted for 28.1% market share in 2025, driven by high healthcare expenditure, well-established optometry networks, and advanced diagnostic facilities. The market is expected to grow at 6.0% CAGR through 2034.
Germanyled Europe, with robust investments in ophthalmic technology, integration of digital phoropters in hospital chains, and high patient awareness regarding vision correction contributing to market adoption.
Asia Pacific
Asia Pacific represented 21.3% of the market in 2025and is projected to grow at a CAGR of 7.4% during 2025–2034. Rising prevalence of refractive errors, urbanization, and improving eye care infrastructure are key growth drivers.
Chinadominated the region, with rapid adoption of advanced phoropters in urban optometry centers and government-supported vision screening initiatives for schools and workplaces enhancing demand.
Middle East & Africa
Middle East & Africa accounted for 5.8% of market share in 2025, with growth expected at a 6.1% CAGR through 2034. Limited access to ophthalmic care in rural areas constrains growth, though adoption in urban hospitals is rising.
Saudi Arabialed the region due to increased investments in healthcare infrastructure, rising disposable income, and import of modern ophthalmic instruments, including digital phoropters.
Latin America
Latin America held 5.3% share in 2025, with forecasted 6.5% CAGR through 2034. Growing demand in private hospitals and optometry centers drives adoption.
Brazilled the region, supported by expansion of urban eye care clinics, vision screening programs, and partnerships with global ophthalmic equipment suppliers.
Competitive Landscape
The Phoropter Marketis moderately consolidated, with top players focusing on product innovation, strategic partnerships, and geographic expansion. Topcon Corporationis a leading player, recently launching a next-generation digital phoropter with AI-assisted auto-refraction capabilities. Other key companies such as Reichert Technologies, Essilor Instruments, Nidek Co., Ltd., and Marco Ophthalmic focus on advanced technology integration, customer support services, and regional expansion to strengthen their market position.
Key Players List
- Topcon Corporation
- Reichert Technologies
- Essilor Instruments
- Nidek Co., Ltd.
- Marco Ophthalmic
- Huvitz Co., Ltd.
- CSO Italia
- Shin-Nippon Optical Co., Ltd.
- Haag-Streit AG
- Keeler Instruments
- Luneau Technology
- Cannon Instrument Company
- Rodenstock GmbH
- Optopol Technology S.A.
- Tomey Corporation
Recent Developments
- 2024: Topcon Corporation launched AI-assisted digital phoropters to enhance auto-refraction precision.
- 2023: Nidek Co., Ltd. introduced portable phoropters for small clinics and mobile eye care units.
- 2023: Marco Ophthalmic expanded distribution in Asia Pacific with localized training programs for optometrists.
- 2022: Essilor Instruments integrated tele-optometry compatibility in its latest digital phoropter model.
- 2022: Reichert Technologies developed cloud-enabled phoropters for improved data management and patient workflow.
Phoropter Market Segments
Type
- Digital Phoropters
- Manual Phoropters
End-User
- Hospitals & Clinics
- Optometry Centers
- Eye Care Labs
Distribution Channel
- Medical Equipment Distributors
- Direct Hospital Procurement
- Online Sales Channels
By Region
- North America
- Europe
- APAC
- Middle East and Africa
- LATAM