Global Sport App Market Size, Share & Trends Analysis Report By Type of App (Fitness and Training Apps, Fantasy Sports Apps, Live Sports Streaming Apps, Team and Player Management Apps), By Sports Category (General Fitness and Multiple Sports Apps, Football/Soccer Apps, Cricket Apps, Running and Cycling Apps), By Country (North America, Europe, APAC, Middle East and Africa, LATAM) and Forecast, 2026-2034
USD 3950
Sport App Market Size
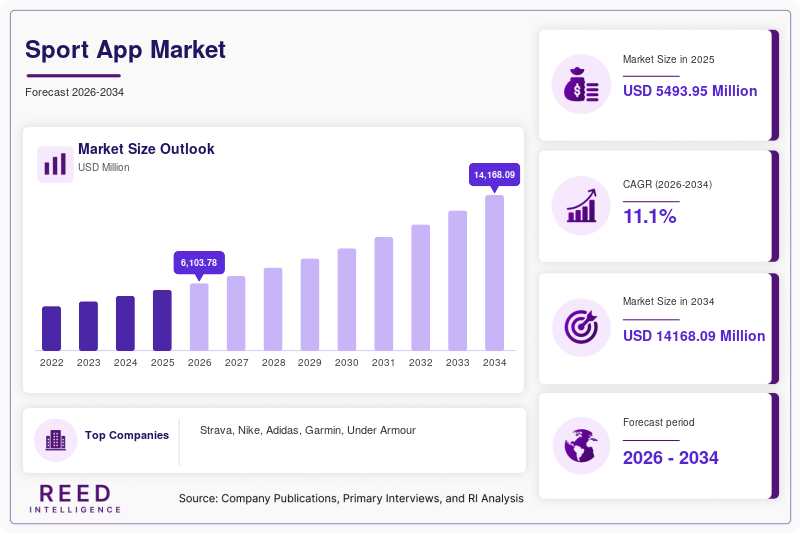
Global Sport App Market size is projected at USD 6,103.78 million in 2026 and is expected to hit USD 13,998.13 million by 2034 with a CAGR of 11.1%. The industry is moving from basic activity logging toward integrated ecosystems combining fitness tracking, streaming, fantasy sports, team management, social engagement, wearable connectivity, and personalized training. Market assessment requires detailed segmentation of monetization models, platforms, sports categories, and users alongside analysis of competitive positioning and technology adoption.
Key Takeaways
- Dominant region: Europe leads in 2026 at USD 2,294.16 million, equivalent to approximately 37.6% of the regional total, and reaches USD 5,188.71 million by 2034 at 10.74% CAGR.
- Fastest-growing region: Asia Pacific advances from USD 1,105.18 million in 2026 to USD 2,621.28 million by 2034, recording the highest regional CAGR of 11.40%.
- Dominant app type: Fitness and Training Apps account for USD 2,253.74 million in 2026, approximately 36.9% of the supplied app-type total, reaching USD 5,126.82 million by 2034 at 10.82% CAGR.
- Fastest-growing app type: Team and Player Management Apps record the highest app-type CAGR at 11.57%, increasing from USD 616.97 million in 2026 to USD 1,481.30 million in 2034.
- Emerging-market indicator: Asia Pacific, encompassing major emerging economies including India, expands by USD 1,516.10 million between 2026 and 2034. A standalone country forecast cannot be derived from the supplied mandatory dataset without introducing unsupported country-level assumptions.
The sport app industry encompasses digital applications enabling fitness training, sports viewing, fantasy participation, athlete and team administration, wagering-related engagement, and sports-oriented social interaction. Based on the supplied dataset, the regional market rises from USD 5,502.41 million in 2025 to USD 6,103.78 million in 2026 and USD 13,998.13 million in 2034. Europe contributes approximately 37.6% of the 2026 regional total, North America 30.8%, Asia Pacific 18.1%, Middle East and Africa 8.2%, and LATAM 5.3%. Within the app-type dataset, Fitness and Training Apps contribute approximately 36.9% of 2026 value, followed by Fantasy Sports Apps at 21.6% and Live Sports Streaming Apps at 15.6%. Digital adoption is increasingly supported by smartphones, connected watches, GPS devices, and cloud-based analytics; Strava reported more than 180 million users across 185+ countries in late 2025 and analyzed billions of activities for its annual trend study.
Sport App Market Trends
AI-Enabled Training, Wearable Integration, and Unified Sports Experiences
Artificial intelligence is shifting sports applications from passive data repositories toward adaptive coaching, conversational discovery, automated recommendations, and personalized content. Strava introduced five additional directly loggable sports in 2026—basketball, volleyball, dance, padel, and cricket—alongside strength-training muscle maps. Its platform already serves 180+ million users in 185+ countries, demonstrating the scale available for data-driven personalization.
Wearable integration is simultaneously reducing dependence on smartphones during activity. Strava added global Apple Watch route navigation, direct workout delivery to Apple Watch and Garmin devices, and enhanced winter-sport tracking; its improved e-bike detection resulted in the reprocessing of top leaderboard rides and removal of 3.9 million activities, including 2.3 million e-bike activities. ESPN's digital ecosystem reached 193.6 million U.S. unique users in June 2025, while its app reached 25.7 million, illustrating the expanding intersection of live content, statistics, fantasy functionality, personalization, and mobile engagement.
Sport App Market Drivers
Smartphone, Wearable, and Connected-Fitness Adoption Expands Global Sport App Market Demand
Growing smartphone availability and connected-device ecosystems are making sports applications persistent components of training and fan engagement. ESPN Digital reached 69.1% of the U.S. adult population in June 2025, while the ESPN App recorded 25.7 million unique users and ESPN Fantasy reached 2.6 million, up 8% year over year. ESPN social properties generated 555 million engagements during the month, exceeding 18.5 million daily, while ESPN.com generated 1.3 billion minutes of consumption, up 6% year over year.
Sport App Market Restraints
Privacy, Subscription Fatigue, Regulation, and Training-Safety Concerns
Sports platforms process location, biometric, payment, performance, and behavioral datasets, increasing compliance and consumer-trust requirements. Training algorithms also face scrutiny when automated targets fail to reflect fatigue or individual circumstances. In fantasy ecosystems, fraud prevention has required real-time systems capable of operating across user bases exceeding 190 million, while research on spending personalization reported a transformer-based model improving MAE by 2.5% and MSE by 21.8% versus its benchmark. These operational requirements increase infrastructure, moderation, compliance, and model-governance costs.
Sport App Market Opportunities
AI Personalization and Multi-Sport Ecosystems Unlock New Monetization
Personalized coaching, conversational sports discovery, wearable-led training, community events, and bundled media create opportunities beyond basic tracking. Strava's 180+ million-user, 185+ country footprint supports increasingly specialized training services, while ESPN's 25.7 million monthly U.S. app users demonstrate the addressable audience for integrated statistics, fantasy, commerce, streaming, and personalization. ESPN Fantasy's 8% year-over-year user increase further highlights cross-service monetization potential.
Challenges in Global Sport App Market
Retention, Data Accuracy, Platform Fragmentation, and User Trust
Operators must maintain accuracy across GPS, wearable, biometric, fantasy, social, and live-content environments while sustaining engagement after initial downloads. Strava's removal of 3.9 million leaderboard activities, including 2.3 million identified as e-bike activities, illustrates the scale of data-quality management. Fantasy-sports research involving platforms serving 200+ million users also demonstrates that higher upselling intensity can improve deposit metrics while reducing satisfaction and conversion, forcing operators to balance monetization against retention.
Sport App Market Segmentation
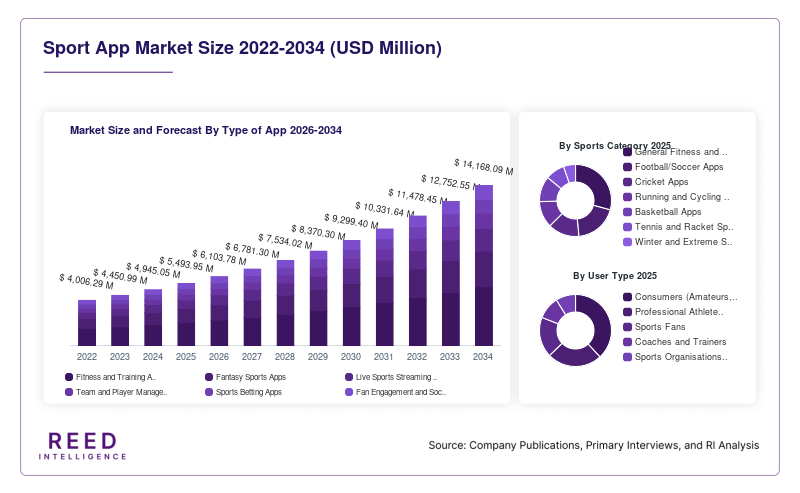
The industry is segmented by type of app, sports category, user type, platform, and revenue model. Among quantified app types, Fitness and Training Apps dominate at USD 2,253.74 million in 2026, representing approximately 36.9%, while Team and Player Management Apps are the fastest-growing category at 11.57% CAGR.
By Type of App
Fitness and Training Apps increase from USD 2,033.69 million in 2025 to USD 2,253.74 million in 2026 and USD 5,126.82 million by 2034, registering 10.82% CAGR. Their leadership reflects recurring training, tracking, wearable integration, and coaching use cases.
Team and Player Management Apps are the fastest-growing subsegment at 11.57% CAGR, ahead of Fantasy Sports Apps at 11.50%. Fantasy Sports Apps reach USD 3,159.92 million by 2034, while Live Sports Streaming Apps reach USD 2,140.45 million.
By Sports Category
General Fitness and Multiple Sports Apps represent the broadest addressable category because one application can serve running, gym, cycling, strength, and recreational users. Quantitative subsegment size and CAGR are not supplied for this segmentation and therefore are not imputed.
Football/soccer, cricket, running and cycling, basketball, racket sports, and winter/extreme sports support specialized engagement. The supplied dataset does not establish a numerically defensible fastest-growing sports category.
By User Type
Consumers, including amateurs and fitness enthusiasts, form the broadest user pool because consumer applications support daily activity tracking, training, social interaction, fantasy participation, and sports viewing. No user-type revenue allocation or CAGR is supplied.
Professional athletes and teams, coaches and trainers, sports fans, and sports organizations and broadcasters form specialized user groups with higher requirements for analytics, collaboration, content, and performance management. Fastest-growing user-type CAGR cannot be calculated from the supplied figures.
By Platform
Mobile Apps across iOS and Android represent the principal delivery platform because smartphones combine GPS, cameras, payments, notifications, video, and social connectivity. The supplied dataset provides no separate mobile-platform revenue or CAGR.
Wearable-Integrated Apps are gaining strategic importance through continuous biometric and activity measurement, while Web/Desktop Apps remain relevant for administration and analytics. Numerical platform CAGR comparisons are not provided and are therefore not fabricated.
By Revenue Model
Freemium models provide broad acquisition funnels by combining zero-cost access with premium functionality, while subscriptions support recurring monetization. The dataset does not allocate the USD 6.11 billion app-type total across individual revenue models.
In-App Purchases, Advertising-Supported, Subscription-Based, and Pay-Per-View/Paywall approaches diversify monetization. No defensible largest or fastest-growing revenue-model CAGR is available from the supplied tables.
Sport App Market Regional Outlook
North America
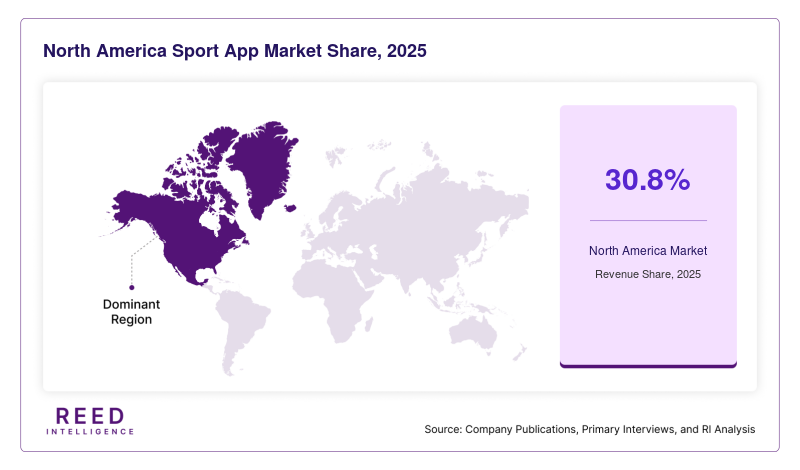
North America reaches USD 1,881.90 million in 2026, approximately 30.8% of the regional total, before increasing to USD 4,250.15 million by 2034 at 10.72% CAGR. The United States anchors regional digital sports consumption; ESPN alone reported 193.6 million U.S. digital/social unique users in June 2025 and 25.7 million app users.
Europe
Europe leads with USD 2,294.16 million in 2026, representing approximately 37.6%, and is projected to reach USD 5,188.71 million by 2034 at 10.74% CAGR. The region benefits from football-centric engagement, mature subscription infrastructure, running and cycling communities, and extensive connected-fitness adoption.
APAC
Asia Pacific expands from USD 1,105.18 million in 2026 to USD 2,621.28 million in 2034, delivering the fastest regional CAGR at 11.40% and approximately 18.1% of 2026 value. India, China, Japan, South Korea, Australia, and Southeast Asia contribute through mobile-first consumption, cricket and football engagement, fitness adoption, and expanding digital payments.
Middle East and Africa
Middle East and Africa accounts for approximately 8.2% in 2026 at USD 497.72 million, rising to USD 1,168.69 million by 2034 at 11.26% CAGR. Gulf markets support premium digital sports services, while smartphone penetration across African economies expands the addressable audience for football, fitness, and streaming applications.
LATAM
LATAM represents approximately 5.3% in 2026 with USD 324.82 million, increasing to USD 769.30 million by 2034 at 11.38% CAGR. Brazil, Mexico, and Argentina underpin regional activity, with football engagement, mobile-first audiences, streaming, fitness tracking, and social sports communities supporting adoption.
Top players in Global Sport App Market
- Strava
- Nike
- Adidas
- Garmin
- Under Armour
- Apple
- Google/Fitbit
- ESPN
- DAZN
- Peloton
- Zwift
- MyFitnessPal
- Runna
- Dream Sports
- Fubo
Top Two Companies
-
Strava: With more than 180 million users across 185+ countries, Strava has a substantial global user-footprint position across running, cycling, fitness, community, and wearable-connected applications. Its 2026 product expansion added 5 sports, muscle mapping, watch-based route navigation, direct Garmin/Apple Watch workout delivery, and improved activity classification. A precise percentage of global industry revenue attributable to Strava cannot be calculated from the mandatory market tables because company revenue allocation is not supplied. Its positioning is therefore best evidenced through its large registered-user footprint and billions of analyzed activities rather than an unsupported revenue-share estimate.
-
ESPN: ESPN holds a particularly strong U.S. sports-app position. In June 2025, ESPN Digital and Social reached 193.6 million unique users, or 69.1% of U.S. adults, while the ESPN App reached 25.7 million unique users. ESPN Fantasy attracted 2.6 million users, increasing 8% year over year, and ESPN social properties generated 555 million monthly engagements. These figures establish significant audience penetration, although they cannot be converted reliably into a percentage of worldwide industry revenue without comparable company-level revenue data for all competitors.
Research Methodology
The assessment uses 2025 as the base year, 2026 as the current year, historical context covering 2022–2024, and forecasts through 2034. The supplied mandatory numerical tables serve as the primary basis for all market valuation, regional contribution, app-type contribution, and CAGR statements. Percentage contributions are calculated directly from supplied totals; for example, Europe's 2026 contribution is approximately 37.6% of USD 6,103.78 million, while Fitness and Training Apps represent approximately 36.9% of the separate USD 6,110.48 million app-type total. The difference between the supplied 2026 regional total of USD 6,103.78 million and app-type total of USD 6,110.48 million, as well as the 2034 totals of USD 13,998.13 million and USD 14,138.18 million, is retained rather than reconciled through unsupported adjustment. Secondary evidence is used only for technology, adoption, company positioning, and recent-development context; unsupported segment, country, and company revenue shares are not fabricated.
Sport App Market Segments
By Type of App
- Fitness and Training Apps
- Fantasy Sports Apps
- Live Sports Streaming Apps
- Team and Player Management Apps
- Sports Betting Apps
- Fan Engagement and Social Sports Apps
By Sports Category
- General Fitness and Multiple Sports Apps
- Football/Soccer Apps
- Cricket Apps
- Running and Cycling Apps
- Basketball Apps
- Tennis and Racket Sports Apps
- Winter and Extreme Sports Apps
By User Type
- Consumers (Amateurs, Fitness Enthusiasts)
- Professional Athletes and Teams
- Sports Fans
- Coaches and Trainers
- Sports Organisations and Broadcasters
By Platform
- Mobile Apps (iOS/Android)
- Wearable-Integrated Apps
- Web/Desktop Apps
By Revenue Model
- Freemium (Free + Premium Features)
- Subscription-Based
- In-App Purchases
- Advertising-Supported
- Pay-Per-View / Paywall
By Region
- North America
- Europe
- APAC
- Middle East and Africa
- LATAM