Global Dried Blueberries Market Size & Outlook, 2025-2033
Global Dried Blueberries Market Insights
- As highlighted in Reed Intelligence analysis, the Global Dried Blueberries Market, worth USD 3460 Million in 2024, is forecasted to achieve USD 6214.49 Million by 2033.
- The Global market is anticipated to grow at a CAGR of 6.7% during the period 2026–2033.
- By 2024, Organic Dried Blueberries represented the largest share of the Product Type market size.
- Organic Dried Blueberries is expected to remain the key growth driver within Product Type, registering the fastest CAGR during the forecast period.
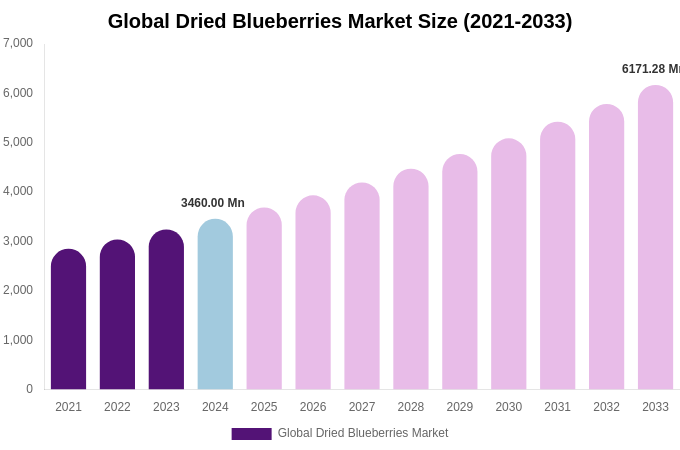
Source: RI Analysis Company Publications, Primary Interviews.

Other Key Findings
- By 2033, United States is forecasted to remain the largest global market for Dried Blueberries Market.
- In Global, Asia Pacific is projected to capture the leading share of market size by 2033.
- Among Global markets, LATAM is expected to post the fastest growth, reaching USD 342.81 Million by 2033.
Report Summary
| Report Scope | Details |
|---|---|
| Base Year for Study | 2024 |
| Study Period | 2021-2033 |
| Historical Period | 2021-2023 |
| Forecast Period | 2025-2033 |
| Market Size In 2024 | USD 3460 Million |
| Market Size In 2033 | USD 6214.49 Million |
| Largest segment | Organic Dried Blueberries |
| Units | Revenue in USD Million |
| CAGR | 6.7% (2025-2033) |
| Segmnetation Covered | |
| Region |
|
| Product Type |
|
| Application |
|
| Distribution Channel |
|
| Report Coverage | Revenue Forecast, Competitive Landscape, Growth Factors, Environment & Regulatory Landscape and Trends |
Global Dried Blueberries Market Region 2025-2033 (USD Million)
| Region | 2021 | 2022 | 2023 | 2024 | 2025 | 2026 | 2027 | 2028 | 2029 | 2030 | 2031 | 2032 | 2033 |
|---|---|---|---|---|---|---|---|---|---|---|---|---|---|
| North America | XX.x | XX.x | XX.x | 1045.96 | XX.x | XX.x | XX.x | XX.x | XX.x | XX.x | XX.x | XX.x | XX.x |
| Europe | XX.x | XX.x | XX.x | XX.x | XX.x | XX.x | XX.x | XX.x | XX.x | XX.x | XX.x | XX.x | XX.x |
| Asia Pacific | XX.x | XX.x | XX.x | XX.x | XX.x | XX.x | XX.x | XX.x | XX.x | XX.x | XX.x | XX.x | XX.x |
| Middle East and Africa | XX.x | XX.x | XX.x | XX.x | XX.x | XX.x | XX.x | XX.x | XX.x | XX.x | XX.x | XX.x | XX.x |
| LATAM | XX.x | XX.x | XX.x | XX.x | XX.x | XX.x | XX.x | XX.x | XX.x | XX.x | XX.x | XX.x | XX.x |
| Total | XX.x | XX.x | XX.x | XX.x | XX.x | XX.x | XX.x | XX.x | XX.x | XX.x | XX.x | XX.x | XX.x |
Source: RI Analysis Company Publications, Primary Interviews.
Global Dried Blueberries Market Product Type 2025-2033 (USD Million)
| Product Type | 2021 | 2022 | 2023 | 2024 | 2025 | 2026 | 2027 | 2028 | 2029 | 2030 | 2031 | 2032 | 2033 |
|---|---|---|---|---|---|---|---|---|---|---|---|---|---|
| Organic Dried Blueberries | XX.x | XX.x | XX.x | 1613.4 | XX.x | XX.x | XX.x | XX.x | XX.x | XX.x | XX.x | XX.x | XX.x |
| Conventional Dried Blueberries | XX.x | XX.x | XX.x | XX.x | XX.x | XX.x | XX.x | XX.x | XX.x | XX.x | XX.x | XX.x | XX.x |
| Wildcrafted Dried Blueberries | XX.x | XX.x | XX.x | XX.x | XX.x | XX.x | XX.x | XX.x | XX.x | XX.x | XX.x | XX.x | XX.x |
| Total | XX.x | XX.x | XX.x | XX.x | XX.x | XX.x | XX.x | XX.x | XX.x | XX.x | XX.x | XX.x | XX.x |
Source: RI Analysis Company Publications, Primary Interviews.
Global Dried Blueberries Market Application 2025-2033 (USD Million)
| Application | 2021 | 2022 | 2023 | 2024 | 2025 | 2026 | 2027 | 2028 | 2029 | 2030 | 2031 | 2032 | 2033 |
|---|---|---|---|---|---|---|---|---|---|---|---|---|---|
| Food and Beverage | XX.x | XX.x | XX.x | 1384.69 | XX.x | XX.x | XX.x | XX.x | XX.x | XX.x | XX.x | XX.x | XX.x |
| Dietary Supplements | XX.x | XX.x | XX.x | XX.x | XX.x | XX.x | XX.x | XX.x | XX.x | XX.x | XX.x | XX.x | XX.x |
| Cosmetics and Personal Care | XX.x | XX.x | XX.x | XX.x | XX.x | XX.x | XX.x | XX.x | XX.x | XX.x | XX.x | XX.x | XX.x |
| Pharmaceuticals | XX.x | XX.x | XX.x | XX.x | XX.x | XX.x | XX.x | XX.x | XX.x | XX.x | XX.x | XX.x | XX.x |
| Total | XX.x | XX.x | XX.x | XX.x | XX.x | XX.x | XX.x | XX.x | XX.x | XX.x | XX.x | XX.x | XX.x |
Source: RI Analysis Company Publications, Primary Interviews.
Global Dried Blueberries Market Distribution Channel 2025-2033 (USD Million)
| Distribution Channel | 2021 | 2022 | 2023 | 2024 | 2025 | 2026 | 2027 | 2028 | 2029 | 2030 | 2031 | 2032 | 2033 |
|---|---|---|---|---|---|---|---|---|---|---|---|---|---|
| Hypermarkets and Supermarkets | XX.x | XX.x | XX.x | 1384 | XX.x | XX.x | XX.x | XX.x | XX.x | XX.x | XX.x | XX.x | XX.x |
| Convenience Stores | XX.x | XX.x | XX.x | XX.x | XX.x | XX.x | XX.x | XX.x | XX.x | XX.x | XX.x | XX.x | XX.x |
| Online Retailers | XX.x | XX.x | XX.x | XX.x | XX.x | XX.x | XX.x | XX.x | XX.x | XX.x | XX.x | XX.x | XX.x |
| Health Food Stores | XX.x | XX.x | XX.x | XX.x | XX.x | XX.x | XX.x | XX.x | XX.x | XX.x | XX.x | XX.x | XX.x |
| Total | XX.x | XX.x | XX.x | XX.x | XX.x | XX.x | XX.x | XX.x | XX.x | XX.x | XX.x | XX.x | XX.x |
Source: RI Analysis Company Publications, Primary Interviews.