Turkey Dry Ice Blasting Machine Market Size & Outlook, 2026-2034
Turkey Dry Ice Blasting Machine Market Insights
- As highlighted in Reed Intelligence analysis, the Turkey Dry Ice Blasting Machine Market, worth USD 2.57 Million in 2025, is forecasted to achieve USD 5.11 Million by 2034.
- The Turkey market is anticipated to grow at a CAGR of 7.91% during the period 2026–2034.
- By 2025, Portable Dry Ice Blasting Machines represented the largest share of the Machine Type market size.
- Portable Dry Ice Blasting Machines is expected to remain the key growth driver within Machine Type, registering the fastest CAGR during the forecast period.
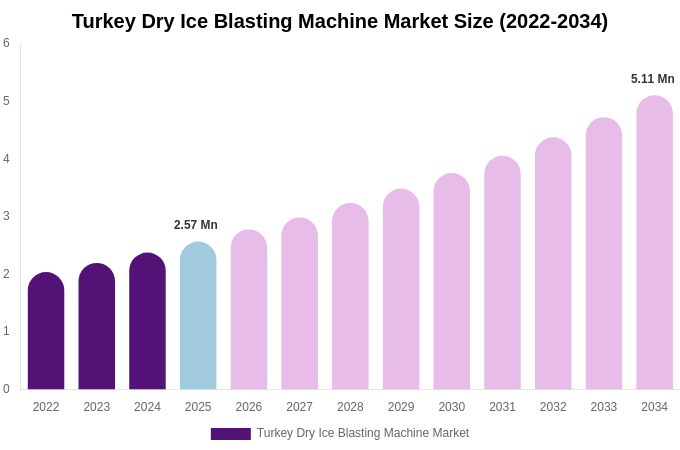
Source: RI Analysis Company Publications, Primary Interviews.

Other Key Findings
- As of 2025, Turkey held 0.41% of the global Dry Ice Blasting Machine Market size.
- By 2034, United States is anticipated to capture the largest share of the global Dry Ice Blasting Machine Market.
- In Middle East and Africa, United Arab Emirates is expected to lead the regional Dry Ice Blasting Machine Market size by 2034.
- Saudi Arabia will remain the fastest-growing market in Middle East and Africa, reaching USD 24.25 Million by 2034.
Report Summary
| Report Scope | Details |
|---|---|
| Base Year for Study | 2025 |
| Study Period | 2022-2034 |
| Historical Period | 2022-2024 |
| Forecast Period | 2026-2034 |
| Market Size In 2025 | USD 2.57 Million |
| Market Size In 2034 | USD 5.11 Million |
| Largest segment | Portable Dry Ice Blasting Machines |
| Units | Revenue in USD Million |
| CAGR | 7.91% (2026-2034) |
| Segmnetation Covered | |
| Machine Type |
|
| Application |
|
| End-Use Industry |
|
| Distribution Channel |
|
| Report Coverage | Revenue Forecast, Competitive Landscape, Growth Factors, Environment & Regulatory Landscape and Trends |
Turkey Dry Ice Blasting Machine Market Machine Type 2026-2034 (USD Million)
| Machine Type | 2022 | 2023 | 2024 | 2025 | 2026 | 2027 | 2028 | 2029 | 2030 | 2031 | 2032 | 2033 | 2034 |
|---|---|---|---|---|---|---|---|---|---|---|---|---|---|
| Portable Dry Ice Blasting Machines | XX.x | XX.x | XX.x | 1.44 | XX.x | XX.x | XX.x | XX.x | XX.x | XX.x | XX.x | XX.x | XX.x |
| Stationary Dry Ice Blasting Machines | XX.x | XX.x | XX.x | XX.x | XX.x | XX.x | XX.x | XX.x | XX.x | XX.x | XX.x | XX.x | XX.x |
| Total | XX.x | XX.x | XX.x | XX.x | XX.x | XX.x | XX.x | XX.x | XX.x | XX.x | XX.x | XX.x | XX.x |
Source: RI Analysis Company Publications, Primary Interviews.
Turkey Dry Ice Blasting Machine Market Application 2026-2034 (USD Million)
| Application | 2022 | 2023 | 2024 | 2025 | 2026 | 2027 | 2028 | 2029 | 2030 | 2031 | 2032 | 2033 | 2034 |
|---|---|---|---|---|---|---|---|---|---|---|---|---|---|
| Industrial Cleaning | XX.x | XX.x | XX.x | 0.91 | XX.x | XX.x | XX.x | XX.x | XX.x | XX.x | XX.x | XX.x | XX.x |
| Precision Cleaning | XX.x | XX.x | XX.x | XX.x | XX.x | XX.x | XX.x | XX.x | XX.x | XX.x | XX.x | XX.x | XX.x |
| Surface Preparation | XX.x | XX.x | XX.x | XX.x | XX.x | XX.x | XX.x | XX.x | XX.x | XX.x | XX.x | XX.x | XX.x |
| Maintenance Cleaning | XX.x | XX.x | XX.x | XX.x | XX.x | XX.x | XX.x | XX.x | XX.x | XX.x | XX.x | XX.x | XX.x |
| Contamination Removal | XX.x | XX.x | XX.x | XX.x | XX.x | XX.x | XX.x | XX.x | XX.x | XX.x | XX.x | XX.x | XX.x |
| Total | XX.x | XX.x | XX.x | XX.x | XX.x | XX.x | XX.x | XX.x | XX.x | XX.x | XX.x | XX.x | XX.x |
Source: RI Analysis Company Publications, Primary Interviews.
Turkey Dry Ice Blasting Machine Market End-Use Industry 2026-2034 (USD Million)
| End-Use Industry | 2022 | 2023 | 2024 | 2025 | 2026 | 2027 | 2028 | 2029 | 2030 | 2031 | 2032 | 2033 | 2034 |
|---|---|---|---|---|---|---|---|---|---|---|---|---|---|
| Automotive | XX.x | XX.x | XX.x | 0.97 | XX.x | XX.x | XX.x | XX.x | XX.x | XX.x | XX.x | XX.x | XX.x |
| Aerospace Defense | XX.x | XX.x | XX.x | XX.x | XX.x | XX.x | XX.x | XX.x | XX.x | XX.x | XX.x | XX.x | XX.x |
| Food Beverage | XX.x | XX.x | XX.x | XX.x | XX.x | XX.x | XX.x | XX.x | XX.x | XX.x | XX.x | XX.x | XX.x |
| Manufacturing | XX.x | XX.x | XX.x | XX.x | XX.x | XX.x | XX.x | XX.x | XX.x | XX.x | XX.x | XX.x | XX.x |
| Energy Power | XX.x | XX.x | XX.x | XX.x | XX.x | XX.x | XX.x | XX.x | XX.x | XX.x | XX.x | XX.x | XX.x |
| Electronics Semiconductor | XX.x | XX.x | XX.x | XX.x | XX.x | XX.x | XX.x | XX.x | XX.x | XX.x | XX.x | XX.x | XX.x |
| Total | XX.x | XX.x | XX.x | XX.x | XX.x | XX.x | XX.x | XX.x | XX.x | XX.x | XX.x | XX.x | XX.x |
Source: RI Analysis Company Publications, Primary Interviews.
Turkey Dry Ice Blasting Machine Market Distribution Channel 2026-2034 (USD Million)
| Distribution Channel | 2022 | 2023 | 2024 | 2025 | 2026 | 2027 | 2028 | 2029 | 2030 | 2031 | 2032 | 2033 | 2034 |
|---|---|---|---|---|---|---|---|---|---|---|---|---|---|
| Direct Sales | XX.x | XX.x | XX.x | 1.41 | XX.x | XX.x | XX.x | XX.x | XX.x | XX.x | XX.x | XX.x | XX.x |
| Indirect Sales | XX.x | XX.x | XX.x | XX.x | XX.x | XX.x | XX.x | XX.x | XX.x | XX.x | XX.x | XX.x | XX.x |
| Total | XX.x | XX.x | XX.x | XX.x | XX.x | XX.x | XX.x | XX.x | XX.x | XX.x | XX.x | XX.x | XX.x |
Source: RI Analysis Company Publications, Primary Interviews.