Optical Workstations Market Size, Share Demand Report By Type (Manual Optical Workstations, Semi-Automated Optical Workstations, Fully Automated Optical Workstations), By Application (Optical Laboratories, Ophthalmic Clinics, Manufacturing & Quality Inspection) By Region & Segment Forecasts, 2026–2034
USD 3950
Optical Workstations Market Size
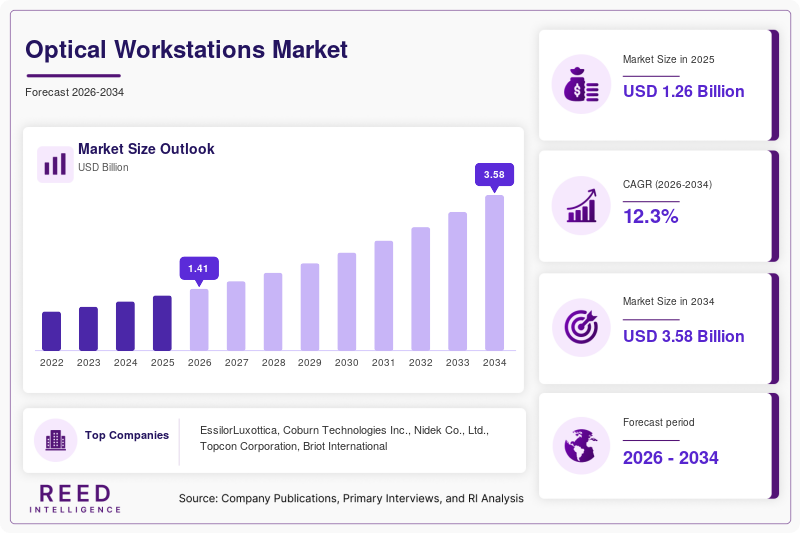
Optical Workstations market size is projected at USD 1.42 billion in 2026 and is expected to hit USD 3.58 billion by 2034 with a CAGR of 12.3%. Market expansion is supported by increasing demand for advanced ophthalmic diagnostics, lens processing systems, and automated optical inspection technologies. Growing investments in vision care infrastructure, precision manufacturing, and laboratory automation are creating substantial opportunities across developed and emerging economies. Detailed segmentation analysis, technology assessment, and competitive landscape evaluation remain critical for market participants.
The optical workstations market consists of integrated systems used for lens measurement, edging, inspection, calibration, optical testing, and ophthalmic diagnostics. Global production surpassed 1.85 million units in 2025, while installation penetration reached approximately 57% among large optical laboratories and healthcare facilities. Optical laboratories accounted for nearly 44% of total deployments, followed by ophthalmic clinics at 33% and manufacturing applications at 23%. More than 680,000 advanced workstations were equipped with automated software platforms in 2025, reinforcing the Optical Workstations market.
Optical Workstations Market Trends
Growing Adoption of Automation and Digital Optics
The shift toward digital lens processing and automated optical measurement systems is accelerating globally. More than 920,000 automated optical workstations were operational worldwide in 2025, representing annual growth of 16%. Adoption rates exceeded 63% among large optical laboratories, while digital workflow integration increased by 21% year-over-year. The incorporation of AI-assisted lens measurement and inspection technologies continues to influence Optical Workstations market trends.
Manufacturers are introducing high-precision systems capable of achieving measurement accuracy below ±0.01 mm and processing speeds exceeding 300 lenses per hour. More than 48% of newly installed systems include cloud-enabled data management and remote monitoring capabilities. Demand from ophthalmic clinics increased by 18%, while industrial quality inspection applications expanded by 15%, strengthening Optical Workstations market trends.
Optical Workstations Market Drivers
Rising Demand for Advanced Vision Care Services
The increasing prevalence of visual impairment and refractive disorders is driving investments in optical infrastructure. More than 2.2 billion people globally require vision correction services, while ophthalmic clinic installations increased by 19% during 2025. Annual lens production exceeded 6.5 billion units worldwide, creating strong demand for precision optical processing equipment. The expansion of eye care networks and diagnostic facilities continues to support Optical Workstations market growth.
Optical Workstations Market Restraints
High Equipment Acquisition and Maintenance Costs
Advanced optical workstations often require investments ranging from USD 15,000 to USD 150,000 per unit depending on automation levels and capabilities. Maintenance expenses account for approximately 8%–12% of total ownership costs annually. Nearly 37% of small clinics delay modernization due to budget constraints, while software integration expenses increased by 11% in 2025. These factors continue to influence Optical Workstations market growth.
Optical Workstations Market Opportunities
Expansion of Smart Optical Laboratories
The emergence of connected laboratories and Industry 4.0 technologies is creating significant opportunities. More than 54% of large optical laboratories have initiated digital transformation programs, while automated workflow adoption increased by 24% during 2025. Smart inspection systems improved operational efficiency by up to 30%, supporting investment in next-generation platforms within the Optical Workstations market.
Challenges in Optical Workstations Market
Skilled Workforce and System Integration Challenges
The operation of advanced optical workstations requires trained personnel capable of handling calibration, diagnostics, and software management. Approximately 29% of facilities report workforce shortages as a key operational challenge. Integration with legacy systems increases deployment timelines by 15%–20%, while training costs can exceed USD 5,000 per operator. These factors continue to affect Optical Workstations market demand.
Optical Workstations Market Segmentation
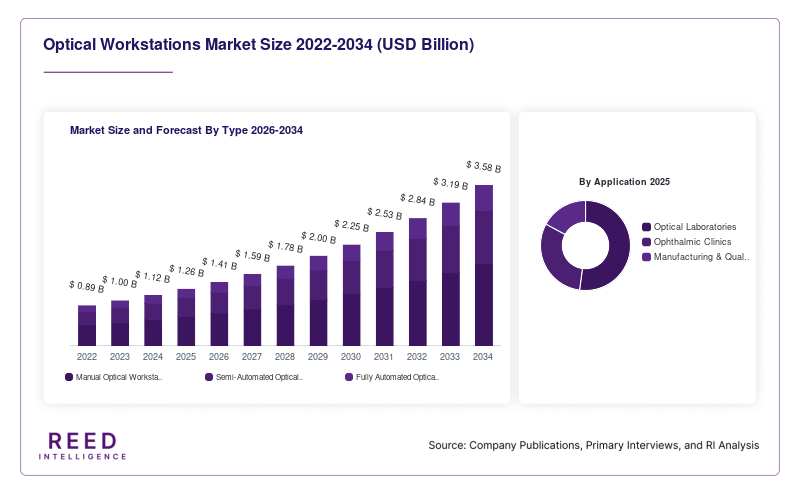
The market is segmented by type and application. Semi-automated optical workstations account for approximately 42% of revenue, followed by fully automated systems at 35% and manual systems at 23%. By application, optical laboratories dominate with 44% share, followed by ophthalmic clinics at 33% and manufacturing & quality inspection at 23%.
By Type
Manual optical workstations accounted for approximately 23% of market revenue in 2025. Production exceeded 425,000 units globally. These systems are widely utilized by small laboratories and independent clinics, offering lens measurement accuracy of ±0.05 mm and lower acquisition costs. Their affordability continues to support steady demand.
Semi-automated optical workstations represented nearly 42% of total market revenue. Global production surpassed 777,000 units during 2025. These systems integrate digital measurement modules, automated calibration functions, and software-assisted workflows. Processing capacity often exceeds 180 lenses per hour, making them the preferred solution for medium-sized laboratories.
Fully automated optical workstations held approximately 35% of market share. Production exceeded 648,000 units globally. These systems feature AI-enabled diagnostics, automated lens processing, cloud connectivity, and measurement accuracy below ±0.01 mm. Their adoption increased by 22% during 2025 across large-scale facilities.
By Application
Optical laboratories generated approximately 44% of total market revenue. More than 810,000 workstation units were operational across lens manufacturing and processing facilities. Adoption penetration exceeded 68% among large laboratories due to increasing requirements for precision, speed, and workflow automation.
Ophthalmic clinics accounted for nearly 33% of total demand. More than 610,000 optical workstations were deployed globally in diagnostic and vision correction centers. Utilization rates increased by 17% as healthcare providers expanded access to advanced eye care services and digital diagnostics.
Manufacturing and quality inspection applications represented approximately 23% of market revenue. More than 425,000 systems were used in industrial inspection, optical component verification, and precision quality control processes. Adoption penetration exceeded 41% among high-precision manufacturing facilities.
Optical Workstations Market Regional Outlook
North America Optical Workstations Market
North America accounted for approximately 34% of global revenue in 2025. The United States contributed nearly 79% of regional demand, supported by advanced healthcare infrastructure and investments in ophthalmic technology. More than 620,000 workstation units were operational across healthcare and industrial sectors.
Europe Optical Workstations Market
Europe represented approximately 29% of the market. Germany, France, Italy, and the United Kingdom collectively accounted for over 67% of regional demand. Production exceeded 510,000 units, supported by strong optical manufacturing capabilities and advanced healthcare systems.
Asia-Pacific Optical Workstations Market
Asia-Pacific held nearly 31% market share and remains the fastest-growing region. China contributed approximately 43% of regional demand, followed by Japan at 18% and India at 13%. Regional production surpassed 720,000 units in 2025, driven by expanding healthcare infrastructure and optical manufacturing investments.
Latin America Optical Workstations Market
Latin America accounted for roughly 4% of global revenue. Brazil represented approximately 46% of regional demand, while Mexico contributed 28%. Increasing access to vision care services and modernization of optical laboratories are supporting regional growth.
Middle East & Africa Optical Workstations Market
The Middle East & Africa region represented approximately 2% of total revenue. The UAE and Saudi Arabia collectively accounted for more than 52% of regional demand. Investments in healthcare modernization and specialty diagnostic centers continue to support market expansion.

Top players in Optical Workstations Market
- EssilorLuxottica
- Coburn Technologies Inc.
- Nidek Co., Ltd.
- Topcon Corporation
- Briot International
- Huvitz Co., Ltd.
- Luneau Technology Group
- Visionix LTD.
- Takubomatic Co., Ltd.
- Satisloh AG
- ZEISS Group
- Rodenstock GmbH
- Fuji Gankyo Kikai Co., Ltd.
- Dia Optical Co., Ltd.
- Shanghai Yanke Instrument Co., Ltd.
EssilorLuxottica
- Estimated market share: 14%–16%.
- Strong global presence across ophthalmic equipment, lens manufacturing, and vision care services.
- Operates extensive optical laboratory networks serving more than 150 countries.
- Significant investments in digital optics, automation, and smart lens processing technologies.
- Broad product portfolio and integrated distribution capabilities strengthen market positioning.
- Continued innovation in connected optical solutions supports long-term competitive advantages.
Coburn Technologies Inc.
- Estimated market share: 10%–12%.
- Leading provider of lens processing systems, optical workstations, and laboratory automation equipment.
- Strong customer base across North America, Europe, and Asia-Pacific.
- Focuses on software-integrated solutions capable of improving operational efficiency by over 25%.
- Extensive service network and technology partnerships enhance customer retention.
- Continuous investment in automation and AI-assisted optical diagnostics supports market leadership.
Recent Developments in Optical Workstations Market
- 2026: Major manufacturers introduced AI-enabled optical workstations with automated lens analysis and cloud-based diagnostics.
- 2025: Several companies launched fully integrated smart laboratory platforms supporting remote monitoring and predictive maintenance.
- 2025: Advanced optical inspection systems capable of processing more than 300 lenses per hour entered commercial deployment.
Optical Workstations Market Segments
By Type
- Manual Optical Workstations
- Semi-Automated Optical Workstations
- Fully Automated Optical Workstations
By Application
- Optical Laboratories
- Ophthalmic Clinics
- Manufacturing & Quality Inspection
By Region
- North America
- Europe
- APAC
- Middle East and Africa
- LATAM